


Understanding the EMA Cross Over Strategy: A Step-by-Step Guide
Learn how to use the EMA crossover strategy for trading The exponential moving average (EMA) cross over strategy is a popular technical analysis tool …
Read Article

When analyzing time series data, it is important to identify trends and patterns in order to make informed decisions. One commonly used tool in time series analysis is the Simple Moving Average (SMA). The SMA calculates the average value of a variable over a specified period of time, and is particularly useful for smoothing out short-term fluctuations and highlighting long-term trends.
The SMA is calculated by taking the sum of a variable’s values over a specified period and dividing it by the number of observations in that period. For example, a 7-day SMA would be calculated by summing the values of the variable over the past 7 days and dividing by 7. This moving average is then plotted on a graph to visualize the trend over time.
The SMA is often used in technical analysis to identify buy and sell signals. When the variable’s value is above the SMA, it is considered bullish and indicates a potential buying opportunity. Conversely, when the variable’s value is below the SMA, it is considered bearish and indicates a potential selling opportunity. Traders often use multiple SMAs with different periods to confirm trends and reduce false signals.
While the SMA is a useful tool in time series analysis, it is important to note that it is a lagging indicator and may not accurately predict future trends. It is best used in conjunction with other tools and indicators to get a more comprehensive understanding of the data. By analyzing the SMA alongside other technical indicators, traders and analysts can make more informed decisions and improve their overall forecasting accuracy.
Overall, the Simple Moving Average is a powerful tool that can help identify trends and patterns in time series data. By calculating the average value over a specified period, the SMA smooths out short-term fluctuations and highlights long-term trends. While it is not a perfect predictor of future trends, when used in conjunction with other indicators, the SMA can provide valuable insights and improve forecasting accuracy.
In time series analysis, a simple moving average (SMA) is a commonly used statistical technique to smooth out variations and noise in a dataset. It provides a clearer picture of the underlying trends or patterns by averaging out the values over a specified time period.

The SMA is calculated by adding up a specific number of data points within a given time period and dividing it by the number of data points. For example, if we consider a 10-day SMA, we would add up the values of the last 10 days and divide it by 10 to get the average.
The main purpose of using a simple moving average is to identify the overall direction of a time series and reduce the impact of short-term fluctuations. It helps in identifying trends, support and resistance levels, and potential reversal points.
The SMA is particularly useful in identifying market trends in financial time series analysis. Traders and investors often use SMAs to make decisions about buying or selling assets. For example, if the current price of a stock is higher than its SMA, it may indicate an upward trend and serve as a buy signal. On the other hand, if the price is lower than its SMA, it may indicate a downward trend and serve as a sell signal.
One limitation of using a simple moving average is that it can be slow to respond to sudden changes or shifts in the dataset. This is because the SMA takes into account a fixed number of previous data points and does not give more weight to recent data. As a result, it may not always be the best indicator for short-term or volatile trends.
Overall, the simple moving average is a valuable tool in time series analysis that helps in deciphering the underlying patterns and trends in a dataset. It is widely used in various fields, including finance, economics, and forecasting.
Read Also: Understanding the Reason Behind the 10-Year Expiry of Stock Options
The Simple Moving Average (SMA) is a widely used statistical technique in time series analysis. It is a method that calculates the average value of a series of data points over a specified time period, giving equal weight to each data point in the calculation.
To calculate the SMA, you need to follow these steps:
Read Also: Steps to Become a Foreign Exchange Trader: A Comprehensive Guide
For example, let’s say we want to calculate the 5-day SMA for a stock’s closing price. We would collect the closing prices of the stock for the past 5 days, sum them up, and divide by 5 to obtain the average.
The SMA is a useful tool in time series analysis as it helps to smooth out short-term fluctuations and highlight long-term trends in the data. Traders and investors often use it to identify potential buy and sell signals, by comparing the current value of the time series with its moving average.
The Simple Moving Average (SMA) is a popular tool used in time series analysis to analyze and understand trends in data. It is a widely used statistical technique that calculates the average of a given set of data points over a specific period of time. The SMA is often used in forecasting and trend analysis, as it can help identify patterns and predict future values based on historical data.
Here are some common applications of the Simple Moving Average in time series analysis:
Overall, the Simple Moving Average is a versatile tool in time series analysis that can be applied in various industries and fields. It helps identify trends, support and resistance levels, and can be used for forecasting and data smoothing. By understanding how to use the SMA effectively, analysts can gain valuable insights and make informed decisions based on historical data.

A simple moving average in time series analysis is a calculation used to analyze data by creating a series of average values over a specific period of time. It is often used to identify trends or patterns in data and can be helpful in making predictions or forecasting future values.
A simple moving average is calculated by taking the average of a set of data points over a specific period of time. Each data point is given a equal weight in the calculation, and the average is recalculated as new data is added or old data is removed. For example, a 10-day simple moving average would be calculated by summing the values of the past 10 days and dividing by 10.
The purpose of using a simple moving average is to smooth out fluctuations and noise in data. It can help to identify trends, patterns, or cycles in the data that may not be apparent when looking at individual data points. It can also be used to make predictions or forecast future values based on the historical data.
A simple moving average can be useful in time series analysis in a variety of situations. It can be used to identify trends, cyclical patterns, or seasonal variations in data. It can also be used to smooth out noise or fluctuations in data to get a better understanding of the underlying pattern. Additionally, it can be used to make predictions or forecast future values based on the historical data.

Learn how to use the EMA crossover strategy for trading The exponential moving average (EMA) cross over strategy is a popular technical analysis tool …
Read Article
Does Savage use Boyds stocks? Savage Arms is a popular firearms manufacturer known for its high-quality rifles. Many gun enthusiasts and hunters are …
Read Article
Employee Benefits of Cisco Cisco is a global technology leader that provides networking solutions to businesses and organizations across the world. …
Read Article
Open Market Selling Rate for 1 Dollar to PKR The Open Market Selling Rate (OMSR) is the rate at which the Pakistani Rupee (PKR) is sold in the open …
Read Article
Is the Singapore Dollar Stronger than the US Dollar? The Singapore dollar is the currency of Singapore, a small island city-state located in Southeast …
Read Article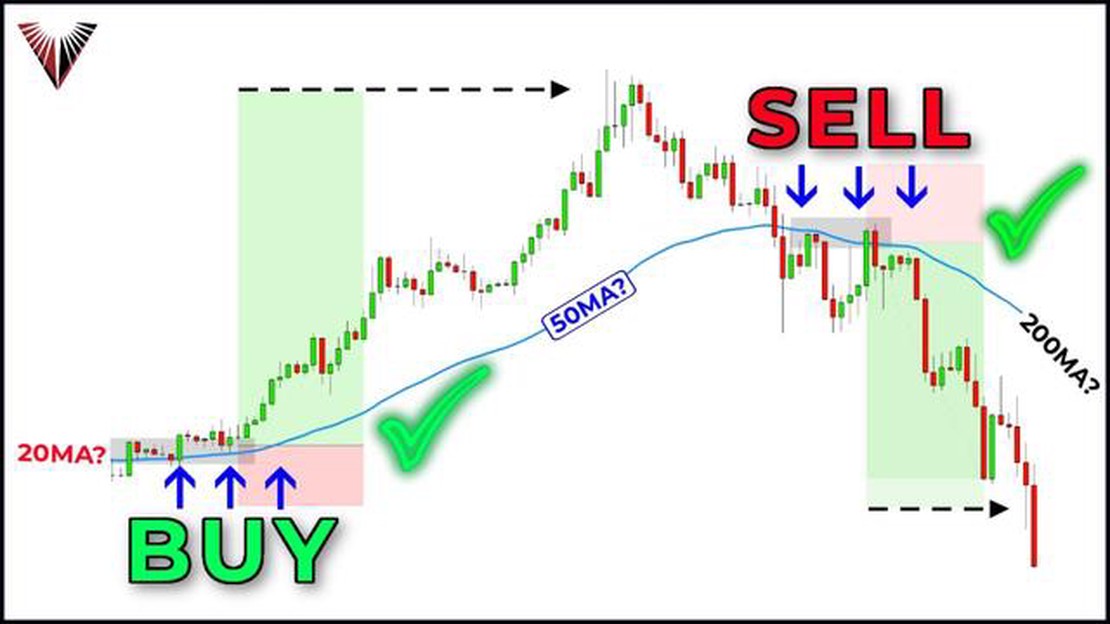
Understanding the 50 day SMA: A Comprehensive Guide In the world of financial markets, trading strategies are constantly evolving to adapt to changing …
Read Article


