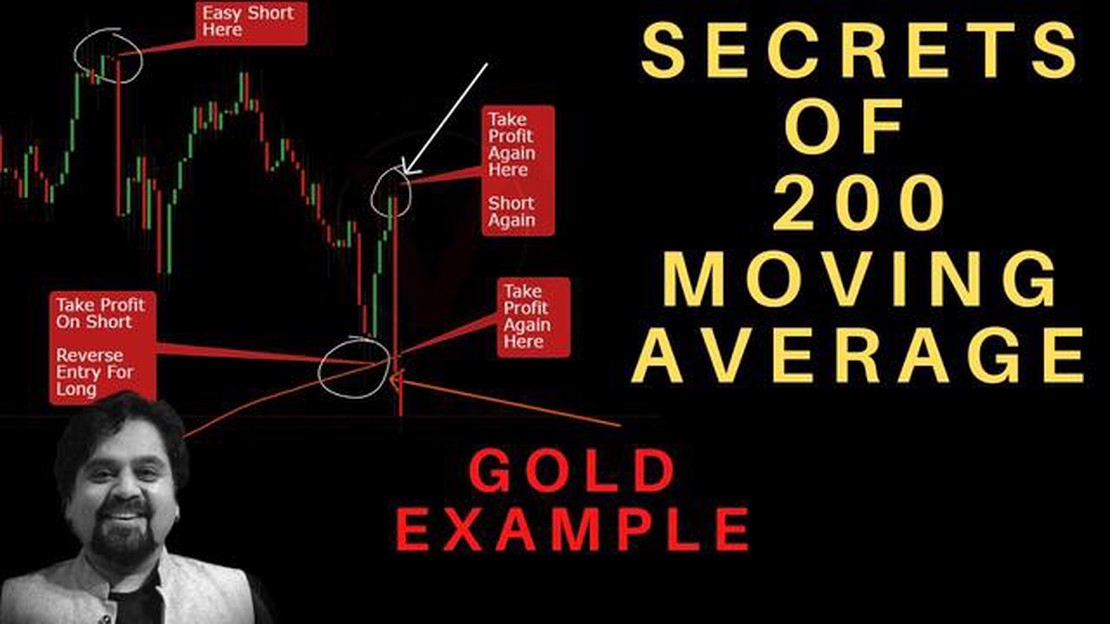
Gold has long been considered a safe haven investment, sought after in times of economic uncertainty and volatility. Traders and investors often rely on various technical indicators to analyze the price movement of gold and make informed decisions. One such indicator that holds significant importance is the 200-day moving average.
Table Of Contents
The 200-day moving average is a widely used tool in technical analysis that helps identify the long-term trend of an asset’s price. It is derived by calculating the average closing price of an asset over the past 200 trading days. In the case of gold, this moving average serves as a crucial reference point for traders and investors.
When the price of gold is trading above its 200-day moving average, it is seen as a bullish signal, indicating that the long-term trend is positive. This suggests that buying pressure is prevailing and that the price is likely to continue rising. On the other hand, when the price is trading below its 200-day moving average, it is considered a bearish signal, suggesting a negative trend. This indicates that selling pressure is dominant, and the price may continue to decline.
Traders often use the 200-day moving average as a level of support or resistance. If the price of gold falls towards or touches the 200-day moving average, it can act as a support level where buying interest may emerge. Conversely, if the price approaches the 200-day moving average from below and fails to break above it, it could act as a strong resistance level, signaling potential selling pressure.
In conclusion, understanding and analyzing the significance of gold’s 200-day moving average can provide traders and investors with valuable insights and help them make more informed decisions. It is a vital tool that can assist in identifying the long-term trend, setting support and resistance levels, and interpreting market sentiment. By paying attention to this technical indicator, market participants can gain a better understanding of gold’s price dynamics and potentially improve their trading strategies.
The Importance of Analyzing Gold’s 200-Day Moving Average
When it comes to analyzing the performance of gold, one metric that often comes into focus is the 200-day moving average. The 200-day moving average is a technical analysis tool that helps investors and traders understand the long-term trend of an asset. For gold, analyzing its 200-day moving average can provide valuable insights into its price movements and potential future direction.
The 200-day moving average is calculated by taking the average closing price of an asset over the past 200 trading days. By smoothing out short-term fluctuations, this moving average helps to identify the overall trend and filter out noise in the price data. It acts as a support or resistance level, indicating whether the price is currently above or below the average.
For gold, analyzing its 200-day moving average can be particularly important due to its historical significance as a safe haven asset. During times of economic uncertainty or market volatility, investors often turn to gold as a store of value. Therefore, changes in gold’s 200-day moving average can reflect changes in the overall sentiment and demand for the precious metal.
When gold’s price is above its 200-day moving average, it indicates that the market sentiment is bullish, and there is a positive trend in place. This can signal strength and potential further price appreciation. On the other hand, when gold’s price falls below its 200-day moving average, it suggests a bearish sentiment and potential further price decline.
Traders and investors often use crossovers of the 200-day moving average as trading signals. When the price crosses above the 200-day moving average, it generates a buy signal, indicating a potential uptrend. Conversely, when the price crosses below the 200-day moving average, it generates a sell signal, indicating a potential downtrend. These crossovers can be used in conjunction with other technical indicators and analysis to make informed trading decisions.
Overall, analyzing gold’s 200-day moving average can provide valuable insights into the long-term trend and sentiment of the market. It helps identify potential buying or selling opportunities, and can assist traders and investors in making more informed decisions. However, it is important to note that no single indicator should be relied upon solely, and it is always recommended to use a combination of analysis techniques when making trading decisions.
Calculating gold’s 200-day moving average is a simple process that involves gathering the closing prices of gold over a 200-day period and then averaging them out. This moving average is a widely used indicator in technical analysis and helps traders and investors to identify trends and make informed decisions about buying or selling gold.
To calculate gold’s 200-day moving average, you will need a dataset of the daily closing prices of gold over a 200-day period. You can obtain this data from various sources, such as financial websites, online trading platforms, or specialized market research providers.
Once you have collected the data, follow these steps:
Step 1: Add up the closing prices for each day in the 200-day period.
Step 2: Divide the total sum by 200 to get the average price.
Step 3: Repeat this calculation each day, removing the oldest price and adding the most recent closing price to the dataset.
The resulting 200-day moving average line can then be plotted on a chart to visualize the trend. If the current price of gold is above the moving average line, it may indicate an uptrend, suggesting that it might be a good time to buy gold. Conversely, if the current price is below the moving average line, it may indicate a downtrend, suggesting that it might be a good time to sell gold.
It’s important to note that the 200-day moving average is just one tool among many used in technical analysis, and it should not be solely relied upon to make trading or investment decisions. It is always recommended to perform comprehensive analysis using multiple indicators and factors before making any trading decisions.
In conclusion, calculating gold’s 200-day moving average is a straightforward process that involves averaging the closing prices over a 200-day period. This indicator helps traders and investors to identify trends in the price of gold and make informed decisions about buying or selling. However, it should be used in conjunction with other analysis methods to ensure accurate decision making.
FAQ:
What is the significance of gold’s 200-day moving average?
The 200-day moving average is a technical indicator commonly used by traders and investors to understand the long-term trend of a financial asset. In the case of gold, its 200-day moving average can provide insights into the overall direction of the market and help identify potential buying or selling opportunities.
How is the 200-day moving average calculated?
The 200-day moving average is calculated by adding up the closing prices of an asset for the previous 200 days and then dividing the sum by 200. This calculation is repeated each day to create a moving average line on a price chart.
What does it mean when gold’s price crosses above its 200-day moving average?
When gold’s price crosses above its 200-day moving average, it is often seen as a bullish sign by traders and investors. It suggests that the market sentiment is turning positive and that the price may continue to rise in the near term.
Can the 200-day moving average be used as a standalone indicator for trading gold?
While the 200-day moving average can provide valuable insights into the long-term trend of gold, it is usually not used as a standalone indicator for trading. Traders and investors typically use it in conjunction with other technical indicators and fundamental analysis to make more informed trading decisions.
How reliable is the 200-day moving average in predicting gold’s price movements?
The reliability of the 200-day moving average in predicting gold’s price movements can vary depending on market conditions and other factors. It is important to use it in conjunction with other indicators and analysis techniques to increase the accuracy of price predictions.
Convert $1000 Singapore to USD Are you planning a trip to Singapore or interested in the current exchange rate between the Singapore dollar (SGD) and …
How many incentive stock options can you have? Incentive Stock Options (ISOs) are a popular form of employee compensation that provide employees with …
Techniques for Analyzing Clues When it comes to solving mysteries, analyzing clues is a fundamental skill. Whether you are a detective trying to crack …