

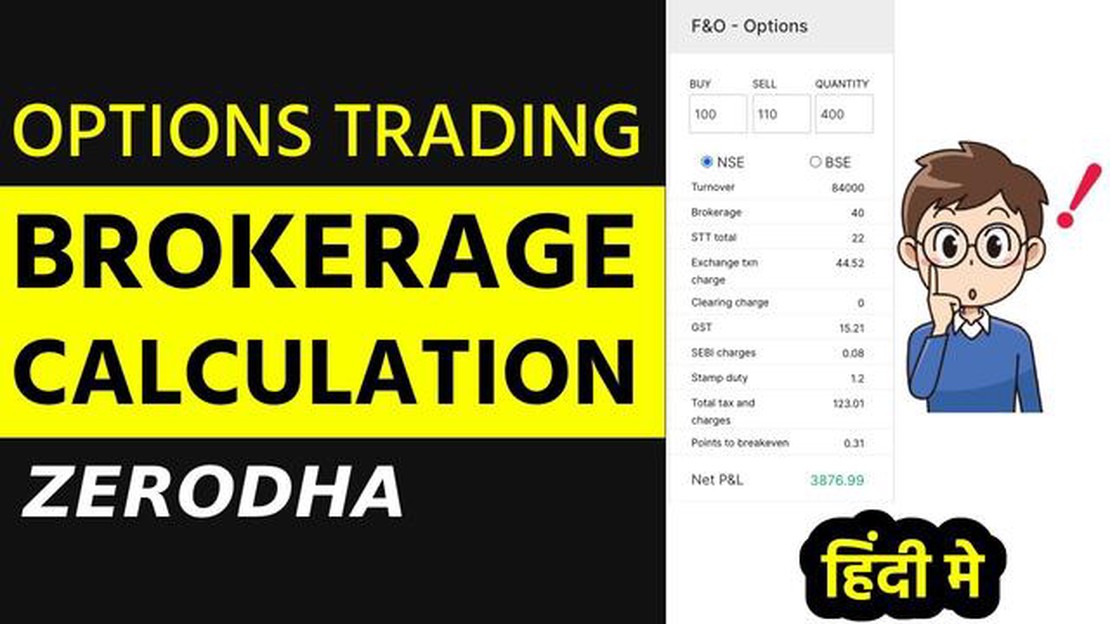

Understanding the Calculation of Brokerage on Options: A Comprehensive Guide
Calculating Brokerage on Options Options trading can be a lucrative investment strategy, but it’s important to understand the various costs involved …
Read Article
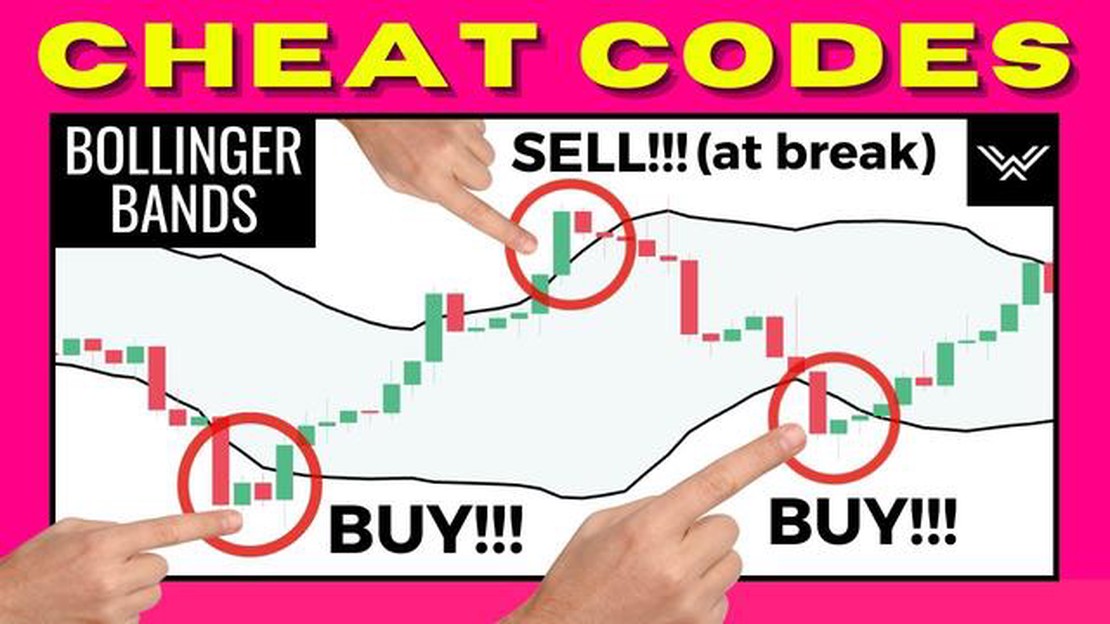
The Bollinger Bands indicator is a popular technical analysis tool used by traders to analyze market volatility and identify potential trading opportunities. Developed by John Bollinger in the 1980s, it consists of a simple moving average (typically 20 periods) and two standard deviation lines plotted above and below the moving average.
One of the key concepts associated with Bollinger Bands is the expansion and contraction of the bands. When the bands are close together, it indicates low market volatility, while a wide separation suggests high volatility. This expansion and contraction can provide valuable insights into potential price reversals and trend changes.
When the market is experiencing a period of low volatility, the Bollinger Bands contract, indicating that a significant price move may be imminent. Traders often interpret this as a signal to prepare for a potential breakout or trend reversal. Conversely, when the bands are expanding, it suggests that volatility is increasing, and traders may look for opportunities to enter trades in the direction of the expanding trend.
Understanding the significance of Bollinger Bands expansion is crucial for traders as it can help them identify optimal entry and exit points. By combining this indicator with other technical analysis tools, such as candlestick patterns or trendlines, traders can increase their chances of making successful trades and maximizing their profits.
It’s important to note that Bollinger Bands expansion is not a standalone trading strategy, but rather a tool that provides additional context and confirmation for other trading signals. Traders should always consider multiple factors before making any trading decisions and use Bollinger Bands expansion as a part of a comprehensive trading plan.
In conclusion, Bollinger Bands expansion is a valuable indicator that helps traders identify periods of increased market volatility and potential trading opportunities. By understanding the significance of Bollinger Bands expansion and incorporating it into their trading strategies, traders can enhance their decision-making process and improve their overall trading performance.
When the price of an asset moves within the upper and lower bands, it is said to be in a range-bound or consolidating phase. However, when the price starts to expand outside the Bollinger Bands, it indicates a potential increase in volatility and directional movement.
| Significance | Description |
|---|---|
| Volatility Breakout | When the price expands beyond the upper or lower band, it suggests a significant increase in volatility. Traders often interpret this as a signal for a potential trend reversal or continuation. |
| Trend Confirmation | If the price expands outside the upper band during an uptrend, or below the lower band during a downtrend, it provides confirmation of the prevailing trend. Traders may use this as an opportunity to enter or add to their positions. |
| Overbought/Oversold Conditions | When the price continuously expands outside the upper band, it suggests that the asset may be overbought and due for a pullback. Conversely, when the price consistently expands below the lower band, it indicates oversold conditions and a potential buying opportunity. |
Traders often use Bollinger Bands in conjunction with other technical indicators and chart patterns to make more informed trading decisions. It is important to note that Bollinger Bands do not provide buy or sell signals on their own but serve as a tool to identify potential trading opportunities and assess market conditions.
In conclusion, understanding Bollinger Bands expansion is crucial for traders as it helps them identify periods of increased volatility and potential trend reversals or continuations. By combining Bollinger Bands with other technical indicators, traders can enhance their trading strategies and improve their overall trading outcomes.
Read Also: Is IQ Option Trading Halal? Find Out Here
Bollinger Bands are a popular technical analysis tool used by traders to measure price volatility and identify potential price reversals. They are a set of three lines plotted on a price chart, with the middle line representing the moving average of the asset’s price over a specific period of time, and the upper and lower lines representing the standard deviations from the moving average.
The primary role of Bollinger Bands is to provide a visual representation of price volatility. When the price becomes more volatile, the bands expand, and when the price becomes less volatile, the bands contract. This expansion and contraction of the bands can help traders identify periods of high and low volatility in the market.
Read Also: Is Meta Trader 5 a broker? | Exploring the features and functionality
In addition to measuring price volatility, Bollinger Bands can also be used to identify potential price reversals. When the price reaches the upper band, it is considered overbought, and a reversal in price may be imminent. Conversely, when the price reaches the lower band, it is considered oversold, and a reversal in price may occur.
Traders can use Bollinger Bands in a variety of ways to make trading decisions. For example, some traders use Bollinger Bands to identify support and resistance levels. When the price touches the upper band, it may act as a resistance level, and when the price touches the lower band, it may act as a support level.
Bollinger Bands can also be used in conjunction with other technical indicators to confirm trading signals. For example, if a trader sees the price reach the upper band and at the same time sees a bearish MACD crossover, it may strengthen their conviction that a price reversal is likely.
In conclusion, Bollinger Bands play a crucial role in trading by providing valuable information about price volatility and potential price reversals. Traders can use Bollinger Bands to make informed trading decisions and enhance their overall trading strategy.
Bollinger Bands are a technical analysis tool that consists of a middle band and two outer bands. The middle band is usually a simple moving average, while the outer bands are generally 2 standard deviations away from the middle band. They are used to measure volatility and identify potential price reversals.

Bollinger Bands expansion occurs when the distance between the upper and lower bands widens. This indicates an increase in volatility and suggests that a significant price move may be imminent.
Bollinger Bands expansion is significant in trading because it can signal potential trading opportunities. When the bands expand, it suggests that volatility is increasing, which can lead to larger price moves. Traders can use this information to identify potential entry or exit points.
Traders can take advantage of Bollinger Bands expansion by looking for price breakouts or trend reversals. When the bands widen, it indicates increased volatility, which can result in significant price moves. Traders can look for breakouts outside of the bands or reversals when the price touches the outer bands.
Yes, there are limitations to using Bollinger Bands expansion in trading. While it can be a useful tool for identifying potential trading opportunities, it is not foolproof. The bands can remain expanded for an extended period of time, and prices can continue to move in one direction without reversing. Traders should always use Bollinger Bands in conjunction with other technical analysis tools for confirmation.

Calculating Brokerage on Options Options trading can be a lucrative investment strategy, but it’s important to understand the various costs involved …
Read Article
How Does the Option Chain Impact Stock Prices? When it comes to understanding the intricacies of the stock market, one important concept to grasp is …
Read Article
Can credit unions help with foreign exchange? Foreign exchange can be a complicated and costly endeavor, especially for individuals who frequently …
Read Article
What is the promo code for Icici Bank money to World? Are you planning to send money abroad? Look no further! Icici Bank has the perfect solution for …
Read Article
Best Places to Exchange Currency for Euros If you are planning a trip to Europe, finding the best currency exchange rates for Euros is essential. …
Read Article
Is MetaTrader 5 Free to Use? MetaTrader 5 is a popular trading software used by traders all over the world. Many people wonder if it is free to use. …
Read Article


