


Is binary options trading illegal in India? Find out here!
Are binary options illegal in India? Binary options trading is a highly debated topic in India. While some people argue that it is a legitimate and …
Read Article
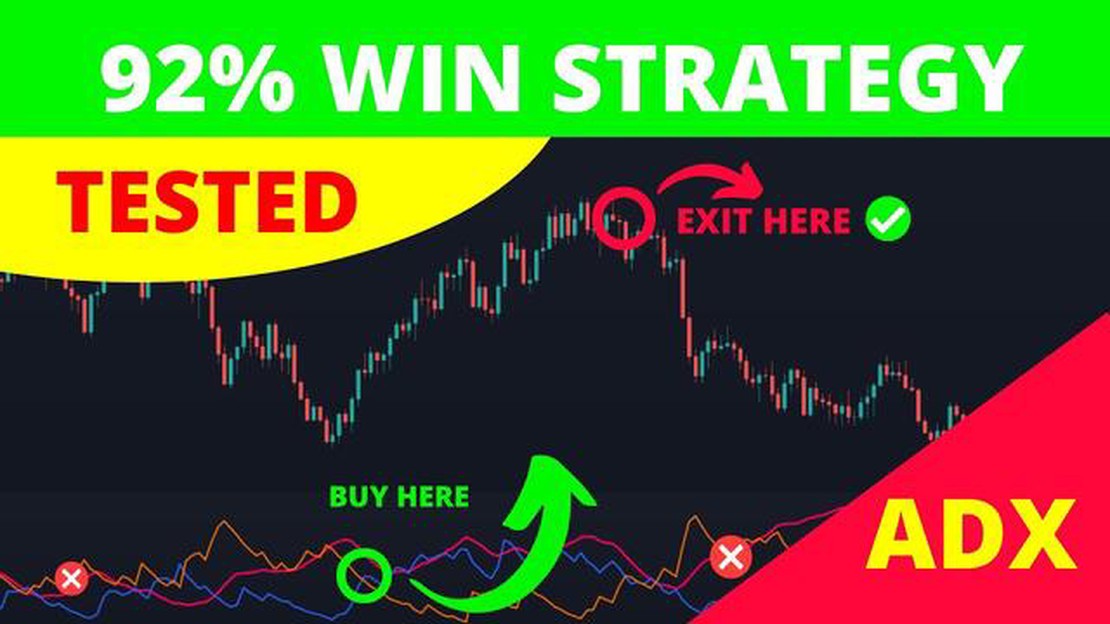
When it comes to analyzing financial markets and making informed trading decisions, it is crucial to have access to reliable indicators. One such indicator that has gained popularity among traders and investors is the Average Directional Index (ADX).
The ADX is a leading indicator that helps traders identify the strength and direction of a trend. Developed by J. Welles Wilder Jr., it is widely used in technical analysis to determine whether a market is trending or consolidating.
The ADX is calculated using a series of mathematical formulas based on the highs and lows of price movements. It provides a numerical value between 0 and 100, where higher values indicate a stronger trend, while lower values suggest a weaker trend or a sideways market.
Traders can also use the ADX to identify potential trend reversals and make timely entry and exit decisions. By understanding how the ADX works and interpreting its readings, traders can gain valuable insights into market trends and take advantage of profitable trading opportunities.
However, it is important to note that the ADX is just one of many tools available to traders, and it should be used in conjunction with other indicators and technical analysis techniques for better accuracy and confirmation of signals.
In this comprehensive guide, we will explore the ADX leading indicator in detail, explaining its calculation method, interpreting its readings, and discussing strategies for incorporating it into your trading approach. Whether you are a beginner or an experienced trader, this guide will provide you with the knowledge and skills to effectively use the ADX and make informed trading decisions.
The Average Directional Index (ADX) is a popular technical analysis tool used to identify the strength of a trend. It was developed by Welles Wilder, who also created other widely used indicators such as the Relative Strength Index (RSI).
The ADX is a leading indicator, meaning it can provide traders with early warnings of a trend’s strength and potential reversals. It consists of three main components: the ADX line, the +DI line, and the -DI line.
The ADX line measures the overall strength of the trend, regardless of its direction. A higher ADX reading indicates a stronger trend, while a lower reading suggests a weaker trend.
The +DI line measures the strength of the positive trend, or the upside movement in price. It is calculated based on the relationship between the high and low prices. A higher +DI reading suggests a stronger positive trend.

The -DI line measures the strength of the negative trend, or the downside movement in price. It is also calculated based on the relationship between the high and low prices. A higher -DI reading suggests a stronger negative trend.
By analyzing the relationship between the ADX, +DI, and -DI lines, traders can assess the strength and direction of a trend. For example, if the ADX is high and both the +DI and -DI lines are moving in the same direction, it indicates a strong trend. Conversely, if the ADX is low and the +DI and -DI lines are moving in opposite directions, it suggests a weak or indecisive trend.
Traders often use the ADX to confirm other technical analysis signals, such as breakouts or trend reversals. A high ADX reading can validate a breakout, while a declining ADX can signal a potential trend reversal.
Read Also: Can Public Banks Accept International Transfers?
It is important to note that the ADX does not provide information about the direction of the trend, only its strength. Traders must use other tools and indicators to determine the actual direction of the trend, such as moving averages or price patterns.
In conclusion, the ADX leading indicator is a valuable tool for traders to assess the strength and potential reversals of a trend. By understanding its components and analyzing their relationship, traders can make more informed trading decisions and improve their overall profitability.
The Average Directional Index (ADX) is a popular technical indicator used by traders to determine the strength of a trend. It measures the strength of a trend regardless of its direction. The ADX is a leading indicator, meaning it gives signals before a change in price action occurs. Traders use the ADX to identify potential trend reversals and the beginning of new trends.
The ADX is calculated using the two other indicators called the Positive Directional Index (+DI) and the Negative Directional Index (-DI). These two indicators are also known as the Directional Movement Indicators (DMI). The ADX is then derived from the difference between the +DI and -DI.
The ADX is displayed as a line that ranges from 0 to 100. A reading below 20 indicates a weak trend, while a reading above 50 indicates a strong trend. Traders often use the 20 and 50 levels as thresholds for determining trend strength.
When the ADX is rising, it suggests that the market is trending and there is momentum behind the current trend. Conversely, when the ADX is falling, it indicates a weakening trend and decreasing momentum. Traders can use this information to make informed decisions about whether to enter or exit trades based on the strength of the current trend.
It’s important to note that the ADX does not provide information about the direction of the trend. It only measures the strength of the trend. To determine the direction of the trend, traders often use other technical indicators or price action analysis in conjunction with the ADX.
Overall, the ADX is a useful tool for traders looking to identify the strength of a trend and potential trend reversals. By understanding the ADX and how it is calculated, traders can make more informed decisions and improve their chances of success in the market.
Read Also: What is the best EMA for 4H?
The Average Directional Index (ADX) is a key tool used in technical analysis to measure the strength of a trend. It provides traders and investors with valuable insights into whether a trend is strong or weak and helps them make informed decisions about when to enter or exit a trade.
One of the main reasons why the ADX is so important in technical analysis is because it helps filter out the noise from price movements. Many other popular technical indicators, such as moving averages or oscillators, can give false signals during periods of consolidation or choppy markets. The ADX, on the other hand, helps identify periods of strong trends and provides confirmation of a valid trend.
Another reason why the ADX is widely used is its ability to identify trend reversals. When the ADX is above a certain threshold, usually set at 25 or 30, it indicates that there is a strong trend in place. However, when the ADX starts to decline, it signals that the trend is losing strength, and a potential reversal might be imminent. This information is crucial for traders who want to stay ahead of market movements and adjust their positions accordingly.

Moreover, the ADX can also be used to determine the direction of a trend. When the ADX is rising, it indicates that the trend is getting stronger, regardless of whether it is an uptrend or a downtrend. Conversely, when the ADX is falling, it suggests that the trend is losing strength. By tracking the ADX along with other technical indicators, traders can gain a deeper understanding of the market dynamics and make more accurate predictions.
In conclusion, the ADX is an essential tool in technical analysis due to its ability to filter out noise, identify trend reversals, and indicate the strength and direction of a trend. By incorporating the ADX into their trading strategies, traders can improve their decision-making process and increase their chances of success in the market.
The ADX leading indicator is a technical analysis tool used to determine the strength of a trend. It is calculated by taking the difference between an asset’s current high and low prices over a specific period of time. A high ADX reading suggests a strong trend, while a low reading indicates a weak trend.
The ADX leading indicator is significant in trading as it helps traders identify and confirm the strength of a trend. By using the ADX, traders can make more informed decisions about when to enter or exit a trade. It also helps in determining when a trend is losing its strength, giving traders a signal to potentially close their positions.
Yes, the ADX leading indicator can be used for all types of assets, including stocks, commodities, and forex. The indicator is not specific to any particular asset class and is widely used by traders to analyze the strength of trends in various markets.
While the ADX leading indicator is a valuable tool, it does have its limitations. One limitation is that it does not provide information about the direction of the trend, only the strength. Traders need to use other tools and indicators in conjunction with the ADX to determine the direction of the trend. Additionally, the ADX can sometimes produce false signals, especially in choppy or sideways markets.
Yes, there are several alternative indicators that can be used alongside the ADX to enhance trading analysis. Some popular indicators include moving averages, Bollinger Bands, and the Relative Strength Index (RSI). These indicators can provide additional insights into the direction and momentum of the market, complementing the information provided by the ADX leading indicator.
The ADX (Average Directional Index) is a leading indicator used in technical analysis to measure the strength of a trend. It consists of three lines: the ADX line, the +DI line, and the -DI line. The ADX line shows the overall strength of the trend, while the +DI line shows the strength of the upward trend, and the -DI line shows the strength of the downward trend. By analyzing the relationship between these lines, traders can determine whether a trend is strong or weak, and whether it is likely to continue or reverse.

Are binary options illegal in India? Binary options trading is a highly debated topic in India. While some people argue that it is a legitimate and …
Read Article
Understanding the Differences Between A and B Brokers If you’re considering entering the world of brokerage, it’s crucial to understand the key …
Read Article
What Makes Citadel so Successful? When it comes to the financial industry, Citadel is a name that stands out from the crowd. With its stellar …
Read Article
Calculating Delta for FX Options Delta is a crucial risk measure used in the world of foreign exchange (FX) options. It quantifies the sensitivity of …
Read Article
Best Places to Exchange Dollars in Thailand Thailand is a popular tourist destination known for its beautiful beaches, rich cultural heritage, and …
Read Article
Is there a future for Citrix? Citrix Systems is a well-known software company that specializes in virtualization, networking, and cloud computing …
Read Article


