


Understanding Forward Contracts in Accounting: Key Concepts and Applications
Understanding Forward Contracts in Accounting Forward contracts are an essential tool in the world of accounting and finance. They allow businesses to …
Read Article
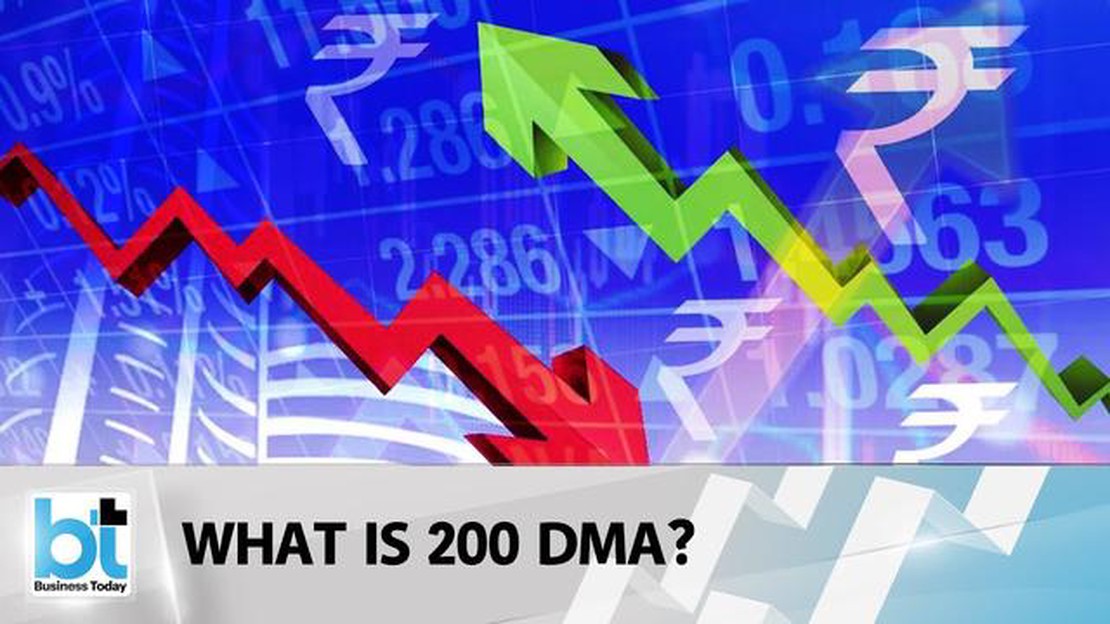
When it comes to analyzing the performance of a stock, there are several technical indicators that investors rely on. One such indicator is the 200-day moving average (DMA). The 200 DMA is a long-term trend line that shows the average price of a stock over the past 200 trading days. This indicator is widely used by traders and investors to determine the overall trend of a stock.
When a stock is trading above its 200 DMA, it is considered to be in an uptrend. This means that the stock’s price is consistently higher than its average price over the past 200 days. This is seen as a positive sign by investors, as it indicates that the stock is gaining momentum and is likely to continue its upward movement.
Trading above the 200 DMA can also act as a support level for a stock. When the stock’s price pulls back, it often finds support at its 200 DMA and bounces back up. This is because many traders and investors place their buy orders near this level, creating a demand that helps push the stock’s price higher.
On the other hand, when a stock is trading below its 200 DMA, it is considered to be in a downtrend. This indicates that the stock’s price is consistently lower than its average price over the past 200 days. It is seen as a negative sign by investors, as it suggests that the stock is losing momentum and may continue its downward movement.
Understanding the significance of a stock trading above its 200 DMA is essential for investors who want to make informed investment decisions. By analyzing this technical indicator, investors can gain insights into the overall trend of a stock and make predictions about its future price movements. However, it is important to note that the 200 DMA is just one of many technical indicators that investors should consider, and it should not be used as the sole basis for investment decisions.
The 200-day moving average (DMA) is a widely used technical analysis tool that helps investors and traders assess the overall trend of a stock over a longer time period. It is a simple calculation that takes the average closing price of a stock over the past 200 trading days.
When a stock is trading above its 200 DMA, it is considered to be in a bullish trend. This is because the stock’s price is consistently higher than its average price over the past 200 days, indicating that there is strong buying pressure and positive investor sentiment. Traders and investors often interpret this as a sign that the stock is likely to continue its upward momentum.

One of the key benefits of a stock above its 200 DMA is that it provides a level of support for the stock’s price. When the stock experiences a pullback or correction, the 200 DMA can act as a floor, preventing the stock from falling further. This is because many traders and investors use this moving average as a key level to buy the stock, believing that it represents a good entry point.
Furthermore, a stock above its 200 DMA can signal a long-term uptrend. When the stock consistently stays above this moving average, it indicates that the stock’s price is trending higher over a longer period of time. This is often taken as a positive sign by investors, as it suggests that the stock has strong underlying fundamentals and positive market sentiment, making it an attractive investment opportunity.
However, it is important to note that a stock above its 200 DMA is not a foolproof indicator of future price performance. While it may suggest a positive trend, it is essential to consider other factors such as market conditions, company news, and fundamental analysis before making investment decisions.
Read Also: Equity Trader Resume Headline: Key Skills and Experience for Success
In conclusion, understanding the importance of a stock trading above its 200 DMA can provide valuable insights for investors and traders. It indicates a bullish trend, provides support levels during pullbacks, and suggests a long-term uptrend. However, it should be used in conjunction with other analysis techniques to make informed investment decisions.
Moving averages are important technical indicators used in stock trading to understand the overall trend of a stock’s price. They are calculated by taking the average price of a stock over a specified period of time, typically ranging from a few days to several months. Moving averages are used to smooth out the price fluctuations and provide a clearer picture of the stock’s direction.
There are two types of moving averages commonly used in stock trading: the simple moving average (SMA) and the exponential moving average (EMA). The SMA gives equal weight to each data point in the period being analyzed, while the EMA gives more weight to recent data points, making it more responsive to changes in the stock’s price.
Traders use moving averages in various ways. One commonly used technique is called the moving average crossover strategy, where traders look for a crossover between the short-term moving average and the long-term moving average. A bullish crossover occurs when the short-term moving average crosses above the long-term moving average, indicating a potential upward trend. Conversely, a bearish crossover occurs when the short-term moving average crosses below the long-term moving average, indicating a potential downward trend.
Read Also: Beginner's Guide to Algorithmic Trading for Quants: Exploring the Basics
Moving averages can also be used to identify support and resistance levels. When a stock’s price consistently bounces off a specific moving average, it indicates that the moving average is acting as a support level. On the other hand, if the stock’s price consistently fails to break above a certain moving average, it indicates that the moving average is acting as a resistance level.
It’s important to note that moving averages are lagging indicators, meaning they are based on historical data and may not accurately reflect the current market conditions. Therefore, it’s essential to use moving averages in conjunction with other technical indicators and analysis methods to make informed trading decisions.
In conclusion, moving averages play a crucial role in stock trading by providing insights into the overall trend of a stock’s price. They help traders identify potential entry and exit points, as well as support and resistance levels. However, it’s important to use moving averages in conjunction with other tools and analysis methods to make informed trading decisions.

When a stock is trading above its 200-day moving average, it is considered to be in an uptrend. This indicates that the stock’s price has been consistently rising over the long term and suggests that the stock may continue to perform well.
When a stock’s price moves above its 200-day moving average, it often signals a bullish trend. This means that buyers are dominating the market and driving the stock’s price higher. This can help to attract more investors and lead to further price appreciation in the stock.
No, a stock’s price being above its 200-day moving average does not guarantee a positive trend. While it is generally seen as a bullish signal, there can still be short-term fluctuations and reversals in the stock’s price. It is important to consider other technical and fundamental indicators before making investment decisions.
Some other important technical indicators to consider alongside a stock being above its 200-day moving average include volume, relative strength index (RSI), and moving average convergence divergence (MACD). These indicators can provide additional insights into the stock’s price trend, momentum, and potential reversal points.
While trading stocks above their 200-day moving average can be profitable, there are still risks involved. Stocks can experience false breakouts or reversals, where the price briefly moves above the 200-day moving average but then falls back below it. It is important to use stop-loss orders and to consider other factors such as market conditions and company fundamentals before making trading decisions.
The 200-day moving average is a technical indicator that calculates the average price of a stock over the past 200 trading days. It is often used by traders and investors to determine the overall trend of a stock.

Understanding Forward Contracts in Accounting Forward contracts are an essential tool in the world of accounting and finance. They allow businesses to …
Read Article
MLB Trade Deadline in 2023: Explained The MLB Trade Deadline is one of the most exciting times of the year for baseball fans and teams alike. It’s a …
Read Article
How to withdraw money from IronFX: Step-by-step guide Withdrawing money from your IronFX account is a straightforward process that can be completed in …
Read Article
Euro Rate in Delhi: Exploring the Currency Exchange Options If you’re planning a trip to Delhi, India, it’s essential to stay updated on the current …
Read Article
Urban forex ownership: Find out who owns Urban forex Urban forex, a leading provider of forex education and trading services, is owned by a team of …
Read Article
What is the trending or ranging indicator? When it comes to analyzing financial markets, one of the key factors that traders and investors pay …
Read Article


