

Current Canadian Dollar Exchange Rate for Selling Today
Canadian Dollar Exchange Rate Today: Selling Price Are you planning a trip to Canada or looking to exchange some Canadian dollars? It’s crucial to …
Read Article
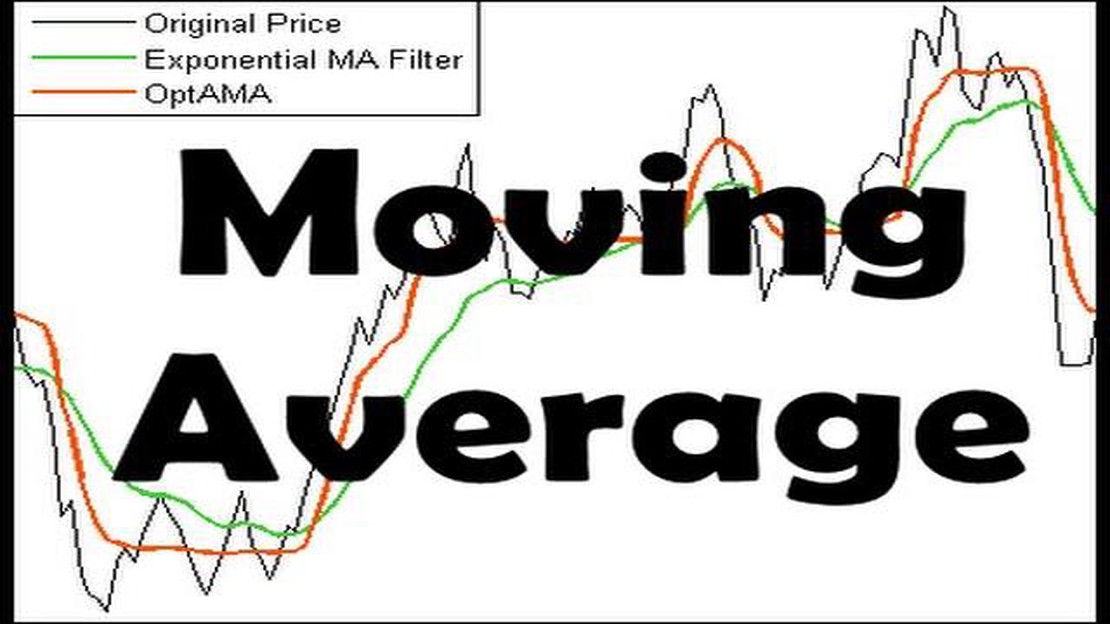
Moving Average is a fundamental technical analysis tool used by traders to analyze and predict price trends in financial markets. It is one of the most widely used indicators, as it provides a clear picture of the overall direction of a market and helps identify potential entry and exit points.
The principle of Moving Average is based on the calculation of the average price over a specific period of time, which smoothens out the price data and eliminates short-term fluctuations. This moving average line is then plotted on a price chart, allowing traders to visualize the trend more easily.
There are different types of Moving Averages, such as the Simple Moving Average (SMA) and the Exponential Moving Average (EMA). The SMA gives equal weight to each data point, while the EMA assigns more weight to recent data. Traders can choose the type of Moving Average that suits their trading style and objectives.
In addition to identifying trends, Moving Averages can also be used to generate trading signals. When the price crosses above the Moving Average, it is considered a bullish signal, indicating a potential buying opportunity. Conversely, when the price crosses below the Moving Average, it is a bearish signal, signaling a possible selling opportunity.
Understanding the principle of Moving Average is crucial for traders looking to make informed and profitable trading decisions. By analyzing the moving average lines and their crossovers with price, traders can gain valuable insights into the market’s direction and momentum, helping them stay ahead of market trends and maximize their trading returns.
In the world of technical analysis, moving average is one of the most widely used indicators. It is a simple yet powerful tool that helps traders identify trend directions and potential support and resistance levels. Moving average is calculated by taking the average price of an asset over a specified period of time, and it smooths out price fluctuations to provide a more accurate representation of the underlying trend.

There are different types of moving averages, including simple moving average (SMA) and exponential moving average (EMA). SMA gives equal weight to all the data points in the calculation period, while EMA gives more weight to recent data, making it more responsive to price changes.
Moving average can be applied to different timeframes, such as daily, weekly, or monthly. The choice of timeframe depends on the trading style and the duration of the trend that the trader wants to capture. Shorter timeframes are more sensitive to price movements and can generate more trading signals, while longer timeframes provide a broader picture of the overall trend.
Traders often use moving average as a confirmation tool or a trigger for entering or exiting trades. When the price crosses above the moving average, it is considered a bullish signal, indicating a potential uptrend. Conversely, when the price crosses below the moving average, it is considered a bearish signal, indicating a potential downtrend.
It is important to note that moving average is a lagging indicator, meaning it is based on past prices. It may not always provide timely signals, especially in volatile market conditions or during sudden price reversals. Therefore, it is advisable to combine moving average with other indicators or trading strategies to increase its effectiveness.
Read Also: Can You Buy and Sell Options Daily? | A Guide to Daily Option Trading
To summarize, moving average is a versatile tool that helps traders analyze price trends and make informed trading decisions. By understanding the basics of moving average and applying it in combination with other tools, traders can gain a better understanding of market dynamics and improve their trading performance.
There are several different types of moving averages that traders and analysts use to analyze financial data. Each type has its own unique characteristics and is useful in different situations. Here are some of the most common types of moving averages:
These are just a few examples of the different types of moving averages. Each type has its own advantages and drawbacks, and it’s important to choose the one that best suits your trading or analysis style.
The Simple Moving Average (SMA) is a commonly used technical indicator that is used to identify trends in a stock’s price over a specific period of time. The SMA is calculated by adding the closing prices of a stock over a certain number of periods, and then dividing that sum by the number of periods. This calculation is performed for each period, resulting in a series of average prices.
The SMA is useful for smoothing out price fluctuations and identifying potential trend reversals. It is often used in combination with other technical indicators to confirm trading signals and make more informed trading decisions. Traders and investors typically use different timeframes for the SMA, such as a 50-day SMA or a 200-day SMA, depending on their investment or trading strategy.
One of the key advantages of using the SMA is its simplicity and ease of calculation. It is also widely available and supported by most charting and trading platforms. However, the SMA may lag behind price action, as it is based on past data. This means that it may not react quickly to sudden market movements or changes in trend direction. Traders should use the SMA in conjunction with other technical analysis tools to improve its accuracy and effectiveness.
Read Also: Ultimate Guide: How to Sell MT4 Indicators and Maximize Your Profit
Overall, the SMA is a popular tool among traders and investors for identifying trends and potential trading opportunities. It provides a straightforward way to gain insights into market conditions and make more informed trading decisions. By understanding how the SMA works and how to interpret its signals, traders can improve their trading strategies and achieve better results in the market.
The moving average principle is a widely used statistical analysis tool that helps identify trends and patterns in data. It calculates the average of a set of values over a specific period of time and plots it on a chart to smoothen out fluctuations and noise in the data.
The moving average is calculated by taking the sum of a certain number of data points over a specific period of time and dividing it by the number of data points. For example, a 5-day moving average would be calculated by summing up the values of the last 5 days and dividing it by 5.
There are several types of moving averages commonly used, including simple moving average (SMA), exponential moving average (EMA), weighted moving average (WMA), and smoothed moving average (SMMA). Each type has its own calculation method and weighting scheme.

The main difference between SMA and EMA is the weighting scheme they use. SMA gives equal weight to all data points in the calculation, while EMA gives more weight to recent data points. This makes EMA more responsive to recent changes in the data, while SMA provides a smoother overall trend.
Moving averages are widely used in trading to identify trends and potential entry or exit points. Traders often look for crossovers between different moving averages or use them as support and resistance levels. For example, when a shorter-term moving average crosses above a longer-term moving average, it may signal a bullish trend and a potential buying opportunity.
A moving average is a statistical calculation used to analyze data points over a certain period of time to identify trends and patterns. It is commonly used in financial and technical analysis to smooth out price movements and reduce noise.
Moving averages are important in investing because they help to identify the direction of a trend and potential support and resistance levels. Traders and investors use moving averages to make informed decisions about buying and selling securities based on the trend direction and crossovers between different moving averages.

Canadian Dollar Exchange Rate Today: Selling Price Are you planning a trip to Canada or looking to exchange some Canadian dollars? It’s crucial to …
Read Article
What happens to vested options when you quit? When you work for a company, especially in the tech industry, you may be offered stock options as part …
Read Article
Minimum Amount to Enter Forex: What You Need to Know Forex trading is a popular way to invest and potentially earn money from the foreign exchange …
Read Article
Who grades Marvel cards? Marvel cards have become immensely popular among collectors and fans of the Marvel Universe. These cards feature stunning …
Read Article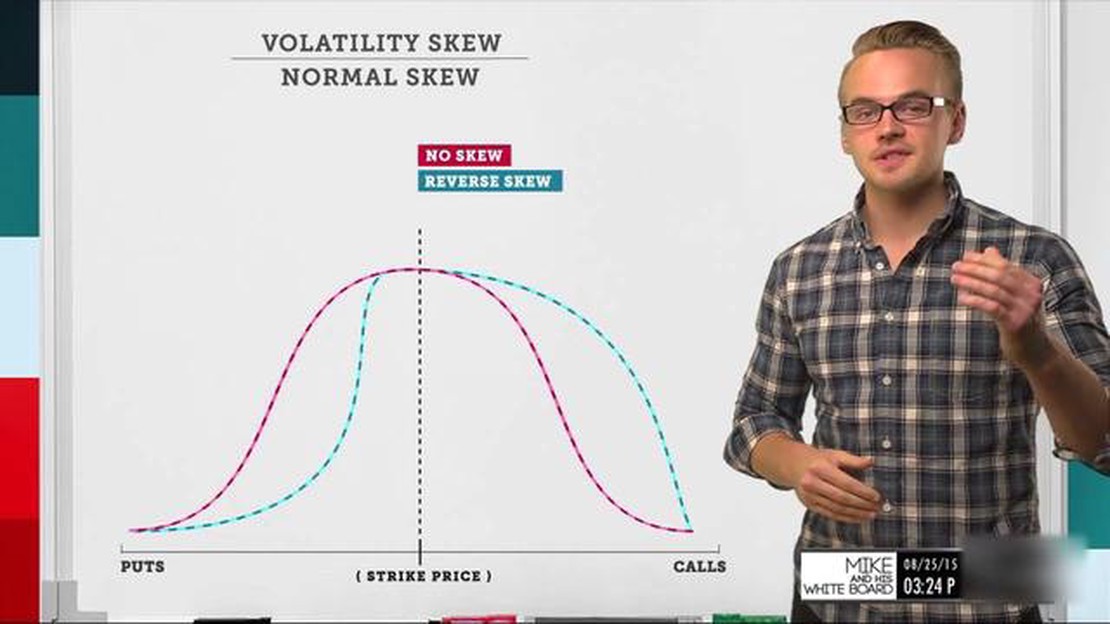
Understanding the Difference between Skew and Volatility In the world of finance and investing, two key terms that often come up are “skew” and …
Read Article
Did the Iroquois Trade Fur? The Iroquois Confederacy, also known as the Haudenosaunee or the Six Nations, played a significant role in the fur trade …
Read Article


