

Understanding Hurst's Time Cycle and Its Application in Financial Analysis
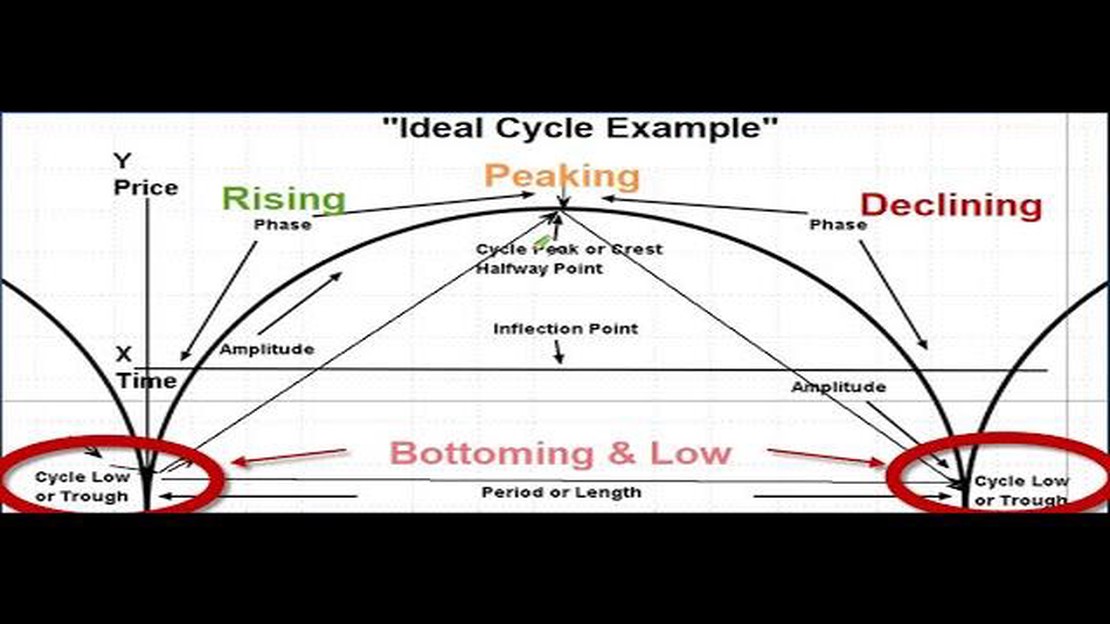
Understanding Hurst’s Time Cycle Hurst’s time cycle is a concept used in financial analysis to identify recurring patterns and predict future market …
Read Article
In finance and statistics, the moving average value is a widely used tool for analyzing data trends over time. It is a simple yet powerful concept that helps to smooth out fluctuations and identify long-term patterns in a dataset. A moving average is calculated by taking the average of a specific number of data points within a given time frame and then moving the calculation window forward to include the next set of data points.
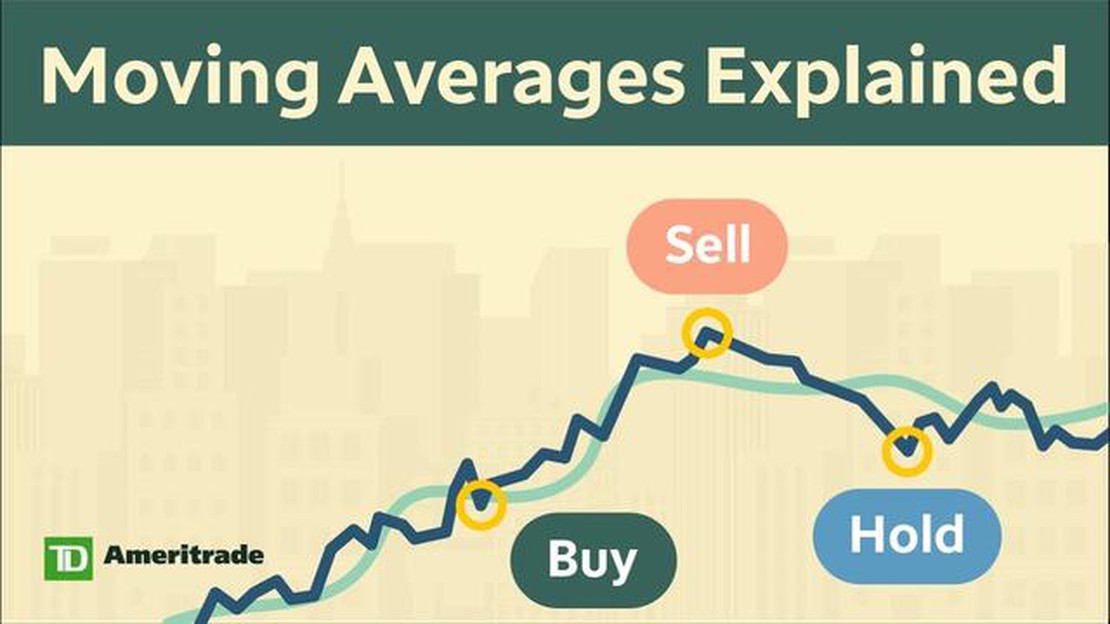
The moving average value is particularly useful in identifying trends and making predictions in financial markets. Traders and investors often use moving averages to identify potential buying or selling opportunities based on the direction and slope of the average line. In technical analysis, the moving average can act as a support or resistance level, helping to confirm or reject potential price reversals.
In addition to financial markets, the moving average value is also employed in various other fields such as engineering, physics, and meteorology. For example, in signal processing, a moving average filter can be used to remove noise from the signal and enhance the underlying trend. In meteorology, a moving average can be applied to temperature or precipitation data to observe long-term climate patterns.
Overall, understanding the moving average value is crucial for anyone involved in analyzing and interpreting data trends. Whether you are a trader, a scientist, or a data analyst, the moving average can provide valuable insights and help you make informed decisions based on historical patterns and future projections.
Moving average value is a commonly used technical analysis tool that helps investors and traders understand the trend and direction of a particular security or market. It is calculated by averaging a set of data points over a specified period of time, with each data point representing the average value of the security during that specific time frame.

The moving average value is frequently used to smooth out short-term price fluctuations and highlight longer-term trends. By calculating the average value over a specific period, it provides a clearer and more reliable representation of the overall price movement.
The main uses of moving average value include:
There are different types of moving averages, including the simple moving average (SMA), exponential moving average (EMA), and weighted moving average (WMA). Each type has its own characteristics and is suited to different market situations.
Overall, the moving average value is a widely used tool in technical analysis, providing valuable insights into market trends and potential trading opportunities.
The moving average value is a statistical indicator that is used to analyze the overall trend or direction of a set of data points over a specific time period. It is commonly used in finance, economics, and other fields to smooth out short-term fluctuations and highlight long-term trends.
Read Also: 7 Effective Ways to Improve Your Forex Trading Skills
The moving average value is calculated by taking the average of a predetermined number of data points from a specified time period. For example, a 10-day moving average value would be the average of the closing prices of an asset or security over the past 10 trading days. As each new data point becomes available, the oldest data point is dropped from the calculation, and a new data point is added.
The moving average value is represented as a line on a chart and is used to identify levels of support and resistance, as well as potential entry and exit points for trades. It is often used in conjunction with other technical indicators, such as the relative strength index (RSI) or the moving average convergence divergence (MACD), to generate trading signals.
There are different types of moving averages, including simple moving averages (SMA), exponential moving averages (EMA), and weighted moving averages (WMA). Each type has its own advantages and disadvantages, and the choice depends on the specific application and the desired level of sensitivity to recent data.
In conclusion, the moving average value is a useful tool for analyzing trends and making trading decisions. It helps to smooth out noise in the data and provides a clearer picture of the overall direction of the market. Traders and analysts use moving averages to identify potential entry and exit points, as well as to confirm or invalidate other technical indicators.
Read Also: How much can you expect to earn in Cyprus?
The moving average value is a commonly used statistical tool that has various applications in different fields. Some of the main uses of the moving average value are:
| Use | Description |
|---|---|
| Trend Analysis | Moving averages can be used to identify and analyze trends in data. By smoothing out the fluctuations in the data, moving averages can help in determining the overall direction of a trend. |
| Forecasting | Moving averages can be used to forecast future values by extrapolating the trend observed in the historical data. This can be helpful in predicting future sales, stock prices, or other variables. |
| Filtering Noise | Moving averages can be used to filter out noise or random fluctuations in data. By calculating the average of a certain number of data points, the effect of noise can be reduced, allowing for a clearer understanding of the underlying patterns. |
| Crossing Signals | Moving averages can be used to generate trading signals. For example, when a short-term moving average crosses above a long-term moving average, it may indicate a bullish signal, suggesting a potential buying opportunity. |
| Support and Resistance Levels | Moving averages can be used to identify support and resistance levels. When the price of an asset crosses above its moving average, it may act as a support level. Conversely, when the price crosses below the moving average, it may act as a resistance level. |
These are just a few examples of how moving averages can be used. The versatility of this tool makes it a valuable asset in data analysis, finance, economics, and many other fields.
The moving average value is a statistical calculation that is used to analyze trends over a specific period of time. It is calculated by taking the average of a set of data points over a sliding window.
The moving average value is calculated by adding up a set of data points over a specific time period and then dividing the sum by the number of points in the set. This calculation is repeated for each subsequent time period, which creates a moving average value.

The purpose of using a moving average value is to smooth out fluctuations in data and identify trends. It helps to visualize the overall direction of the data and filter out any random noise or short-term fluctuations.
Moving average values are commonly used in finance to analyze stock prices, identify trends, and generate trading signals. They can help investors make informed decisions about buying or selling stocks and other financial instruments.
Yes, moving average values can be used in various fields apart from finance. They are commonly used in data analysis, time series forecasting, and quality control. The concept of moving averages can be applied to any set of data points that exhibit a trend over time.
A moving average is a statistical calculation used to analyze data points by creating a series of averages over a specific period of time.

Understanding Hurst’s Time Cycle Hurst’s time cycle is a concept used in financial analysis to identify recurring patterns and predict future market …
Read Article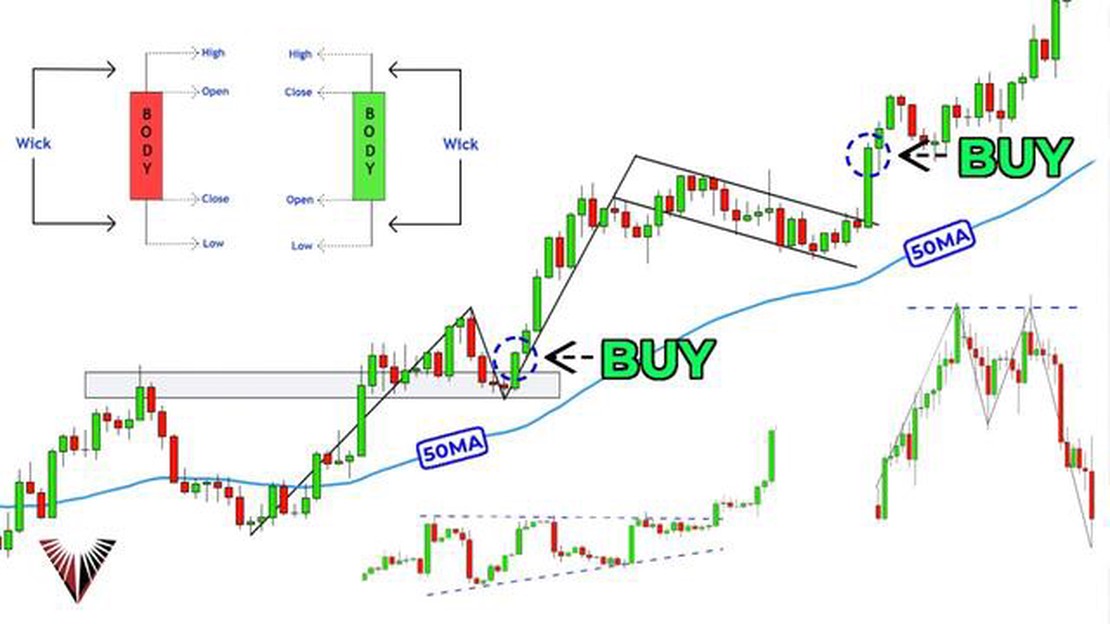
Guide to Analyzing Options Trading Options trading is a popular investment strategy that involves buying and selling options contracts on the stock …
Read Article
Ways to Forecast Inventory: A Comprehensive Guide Forecasting inventory is essential for any business that deals with physical products. Accurate …
Read Article
What to Expect When Your Company Gets Acquired Going through an acquisition can be a daunting and uncertain time for any company. The process of being …
Read Article
What is the Best Market to Scalp Trade? Scalp trading is a popular technique used by traders to make quick profits by taking advantage of small price …
Read Article
Understanding CCI in Forex Trading When it comes to Forex trading, there are numerous technical indicators that traders use to help analyze the market …
Read Article


