


JP Morgan vs Goldman Sachs: Which Investment Bank is Superior?
JP Morgan vs Goldman Sachs: Which is the Better Investment Bank? JP Morgan and Goldman Sachs are two of the most prominent and influential investment …
Read Article
When it comes to technical analysis in the world of trading, one of the most commonly used tools is the moving average. Traders rely on moving averages to identify trends, determine support and resistance levels, and generate buy and sell signals. However, the moving average ribbon takes this concept to a whole new level. This comprehensive guide will explain what the moving average ribbon is, how it is calculated, and how traders can use it to improve their trading decisions.
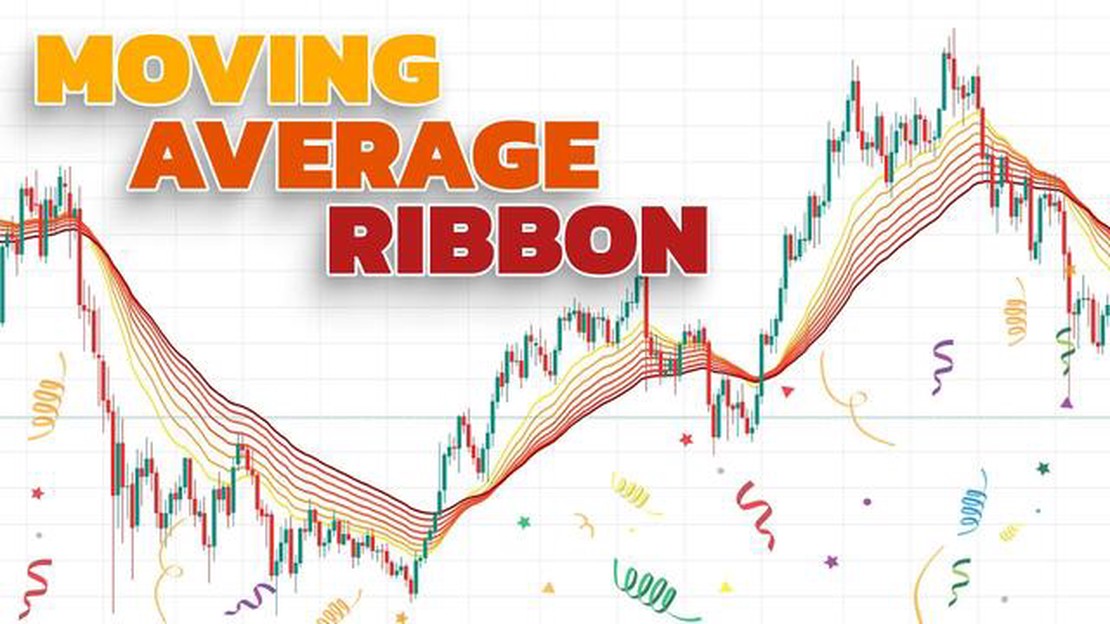
The moving average ribbon is a collection of multiple moving averages displayed on a price chart. Unlike a single moving average, which only considers a specific time period, the ribbon includes multiple moving averages with different timeframes. The idea behind the ribbon is to provide traders with a comprehensive view of the price action by considering different time periods simultaneously.
Each moving average in the ribbon represents a different timeframe, ranging from short-term to long-term. The moving averages are usually plotted as different colored lines on the chart, creating a ribbon-like appearance. By analyzing the interaction between these moving averages, traders can gain insights into the overall trend and momentum of a financial asset.
Traders can use the moving average ribbon in various ways. One common technique is to look for “ribbon crossovers,” where the shorter-term moving averages cross above or below the longer-term moving averages. This crossover can indicate a potential trend reversal or confirmation. The moving average ribbon can also be used to identify potential support and resistance levels, as areas where the price tends to bounce off or break through the ribbon.
In conclusion, the moving average ribbon is a powerful tool that combines multiple moving averages of different timeframes to provide traders with a comprehensive view of the price action. By analyzing the interaction between these moving averages, traders can gain valuable insights into the trend and momentum of a financial asset. Whether used for trend identification, momentum analysis, or support and resistance levels, the moving average ribbon can be a useful addition to any trader’s toolkit.
The moving average ribbon is a technical analysis tool that consists of multiple moving averages plotted on a chart. It is used to identify trends and potential reversal points in the price of a financial instrument. The ribbon is created by plotting a series of moving averages with different time periods, typically ranging from short-term to long-term moving averages.
Each moving average in the ribbon represents the average price of the financial instrument over a specific time period. By plotting multiple moving averages, the ribbon provides a visual representation of how the different time periods are converging or diverging, giving traders a clearer understanding of the overall trend.

When the moving averages in the ribbon are closely spaced and moving in the same direction, it indicates a strong and stable trend. Conversely, when the moving averages are widely spaced and crossing each other frequently, it suggests a period of indecision or potential trend reversal.
| Short-term Moving Average | Medium-term Moving Average | Long-term Moving Average |
|---|---|---|
| 10-day | 50-day | 200-day |
The table above provides an example of a moving average ribbon, where three moving averages with different time periods are plotted. The short-term moving average represents the average price over a 10-day period, the medium-term moving average represents the average price over a 50-day period, and the long-term moving average represents the average price over a 200-day period.
Traders use the moving average ribbon to generate trading signals. For example, when the short-term moving average crosses above the medium-term moving average and both are above the long-term moving average, it is considered a bullish signal. Conversely, when the short-term moving average crosses below the medium-term moving average and both are below the long-term moving average, it is considered a bearish signal.
The moving average ribbon is a versatile tool that can be applied to various financial instruments and timeframes. Whether used alone or in combination with other technical indicators, the ribbon provides valuable insights into the price action and helps traders make informed trading decisions.
Read Also: Understanding CPL Forex and Its Benefits | Forex Trading Guide
The moving average ribbon is a powerful technical analysis tool that can help traders identify trends and potential entry and exit points in the market. By using multiple moving averages with different time periods, the ribbon provides a more accurate and comprehensive view of price movements. Here are some tips on how to effectively use the moving average ribbon:
1. Identify the trend: The first step is to determine the prevailing trend in the market. The moving average ribbon can help you identify whether the market is in an uptrend, downtrend, or ranging. If the ribbon is sloping upwards, it indicates an uptrend, while a downwards sloping ribbon indicates a downtrend.
2. Use crossovers: Look for crossovers between the moving averages in the ribbon. A bullish crossover occurs when a shorter-term moving average crosses above a longer-term moving average, indicating a potential buying opportunity. Conversely, a bearish crossover occurs when a shorter-term moving average crosses below a longer-term moving average, indicating a potential selling opportunity.
3. Pay attention to support and resistance: The moving average ribbon can also be used to identify support and resistance levels. When the price approaches the ribbon from below and bounces off, it can act as a support level. Conversely, when the price approaches the ribbon from above and fails to break through, it can act as a resistance level.
Read Also: Understanding RSU in Canada: A Complete Guide
4. Confirm with other indicators: While the moving average ribbon is a powerful tool on its own, it is always a good idea to confirm its signals with other technical indicators. For example, you can use oscillators like the Relative Strength Index (RSI) or the Moving Average Convergence Divergence (MACD) to validate the signals generated by the ribbon.
5. Adjust the time periods: The moving average ribbon allows you to customize the time periods of the moving averages to fit your trading strategy or the specific market conditions. By experimenting with different time periods, you can find the optimal setting that works best for you.
6. Practice proper risk management: As with any trading strategy, it is important to practice proper risk management when using the moving average ribbon. This includes setting stop-loss orders, managing position sizes, and not relying solely on the ribbon for making trading decisions.
Overall, the moving average ribbon is a versatile tool that can enhance your trading strategy by providing a clearer picture of market trends and potential entry and exit points. With proper analysis and risk management, it can be a valuable addition to your technical analysis toolkit.
The moving average ribbon is a technical analysis tool that consists of multiple moving averages of different lengths. These moving averages are plotted on a price chart and form a ribbon-like pattern.

The moving average ribbon works by providing visual cues about the trend direction and potential support or resistance areas. When the moving averages are clustered together, it indicates a consolidation period, while wider spacing between the moving averages suggests a strong trend.
Using the moving average ribbon can help traders identify overall trend direction, spot potential reversals, and determine suitable entry and exit points in the market. It also provides a clearer visual representation of the price action compared to using a single moving average.
There are several common strategies that traders use with the moving average ribbon. One strategy is to look for price breakouts when the ribbon expands and the moving averages diverge. Another strategy is to wait for a pullback to the ribbon and enter a trade in the direction of the overall trend.
Like any technical analysis tool, the moving average ribbon is not foolproof and can generate false signals. It is important for traders to use other indicators or confirmatory signals to validate the trading decisions. Additionally, using too many moving averages in the ribbon can make the chart cluttered and confusing.
The Moving Average Ribbon is a technical analysis tool that consists of multiple moving averages of different time periods plotted on a chart. It is used to identify trends and potential trade opportunities in the financial markets.

JP Morgan vs Goldman Sachs: Which is the Better Investment Bank? JP Morgan and Goldman Sachs are two of the most prominent and influential investment …
Read Article
What is the Formula for the Moving Average of a Month? When analyzing data over time, especially in fields such as finance, the moving average is a …
Read Article
Displaying OHLC in Metatrader 4 If you are a trader using Metatrader 4, you may be interested in displaying OHLC data, which stands for Open, High, …
Read Article
Grant Date for Incentive Stock Options: What You Need to Know When it comes to incentive stock options (ISOs), the grant date plays a crucial role in …
Read Article
Calculating the Number of Lots for $1000 in Forex When it comes to forex trading, understanding the concept of lots is essential. A lot refers to the …
Read Article
Is IB broker safe? When it comes to online trading, one of the most important factors to consider is the safety of your funds and personal …
Read Article


