


What is the Full Form of FLM in Money Changer? | Explanation and Details
Full Form of FLM in Money Changer FLM stands for Foreign Language Money in the context of money exchange. It refers to the service provided by money …
Read Article
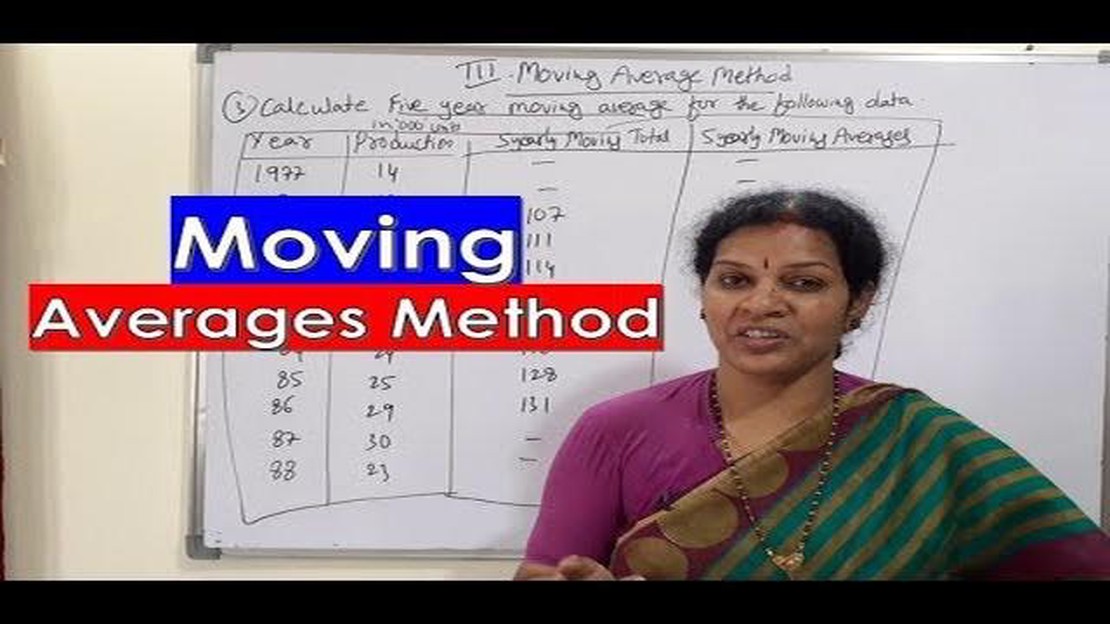
The moving average method is a widely used statistical technique that helps to analyze and interpret time series data. It is particularly useful for identifying trends and patterns in a dataset, as well as for making future predictions. By calculating the average of a specific number of data points over a given period, the moving average method provides a smoothed representation of the data, making it easier to spot underlying patterns.
In this article, we will explore the concept of moving averages in statistics. We will delve into the different types of moving averages, such as the simple moving average and the weighted moving average, and discuss how they are calculated and interpreted. Additionally, we will examine the advantages and limitations of using moving averages in statistical analysis, and explore some practical applications of this technique.
Understanding moving averages is crucial for anyone working with time series data, such as financial analysts, economists, and market researchers. By harnessing the power of this statistical tool, analysts can gain valuable insights into the behavior of variables over time, identify trends, and make informed predictions. Whether you are new to statistics or already have some experience, this article will provide you with a solid foundation in understanding the moving average method.
The moving average method is a commonly used statistical technique for analyzing time series data. Time series data refers to a set of data points collected at specific time intervals and is often used to analyze patterns and trends over time.
The moving average method calculates the average value of a data set over a specific period by continuously updating the average as new data points become available. This technique is particularly useful for smoothing out short-term fluctuations or noise in the data, thereby highlighting the underlying trend or pattern.

There are different variations of the moving average method, including the simple moving average (SMA) and the exponential moving average (EMA). The SMA calculates the average by adding up the values over a specified period and dividing it by the number of observations. The EMA, on the other hand, assigns a weight to each data point, giving more importance to recent observations.
The moving average method has various applications across different fields. In finance, it is often used to analyze stock prices and predict future trends. In economics, it can be used to analyze economic indicators such as GDP and inflation rates. In weather forecasting, it can be applied to analyze temperature or precipitation data.
Overall, the moving average method is a valuable statistical tool for smoothing out data and identifying underlying trends or patterns. It provides insights into the behavior of time series data, making it useful for decision-making and forecasting purposes.
The moving average method is a statistical technique used to analyze and forecast time series data. It is a commonly used method in statistics and is particularly useful in identifying trends and patterns in data.
Read Also: Understanding the Accounting Treatment: Is a Forex Gain a Debit or Credit?
In the moving average method, a sequence of data points is analyzed by calculating the average of a fixed number of previous data points, known as the window size. This average value is then used as the forecast for the next data point. The window size can be chosen based on the frequency of the data and the desired level of smoothing or responsiveness to changes in the data.
One of the key principles of the moving average method is that it assumes that the future values in a time series are a function of the previous values. By taking the average of the historical data points, the method aims to capture the underlying trend or pattern in the data and use it to make predictions for the future.
There are different types of moving averages, including simple moving averages (SMA) and exponential moving averages (EMA). SMA assigns equal weight to all the data points within the window, while EMA assigns more weight to recent data points. The choice of which moving average to use depends on the specific requirements of the analysis and the nature of the data.
The moving average method can be applied to a wide range of applications, including financial markets, weather forecasting, and demand forecasting. It provides a simple yet effective way to understand and analyze time series data, making it a valuable tool in the field of statistics.
There are several types of moving averages that can be used in statistics. Each type has its own characteristics and is suitable for different applications. Here are some commonly used types:
These are just a few examples of the different types of moving averages available. Each type has its own advantages and limitations, and the choice of moving average depends on the specific application and data characteristics.
Read Also: Forex vs Stocks: Understanding the Differences and Benefits
The moving average method in statistics is a technique used to analyze time series data by calculating the average of a specific number of past observations.
The moving average method is calculated by adding together a predetermined number of past observations and dividing by the number of observations in the calculation. This provides a smoothed average of the data over a period of time.
The purpose of using the moving average method is to identify trends or patterns in time series data, smooth out random fluctuations, and make forecasts or predictions based on historical data.
The advantages of using the moving average method include its simplicity, ability to reduce noise or fluctuations in the data, and ability to identify long-term trends or patterns.

Yes, there are limitations to using the moving average method. It can be sensitive to outliers or extreme values in the data, and it may not be suitable for analyzing data with complex patterns or seasonal variations.
The moving average method is a statistical technique used to analyze time series data. It calculates the average value of a set of data points over a specified period of time, and then moves that window of time forward to provide a new average value.
The moving average method is commonly used in finance to analyze stock prices and market trends. It can help identify potential trends and signal when to buy or sell stocks. Traders often use moving averages as a tool to smooth out price fluctuations and determine areas of support and resistance.

Full Form of FLM in Money Changer FLM stands for Foreign Language Money in the context of money exchange. It refers to the service provided by money …
Read Article
Trading ETF Options: What You Need to Know Trading ETF options can be an excellent way to diversify your portfolio and potentially boost your returns. …
Read Article
How Long Does It Take to Become a Trader? If you’ve ever wondered how long it takes to become a successful trader, the answer may surprise you. …
Read Article
Understanding Stock Incentive Plans for Employees Employee stock incentive plans have become increasingly popular in the corporate world. These plans …
Read Article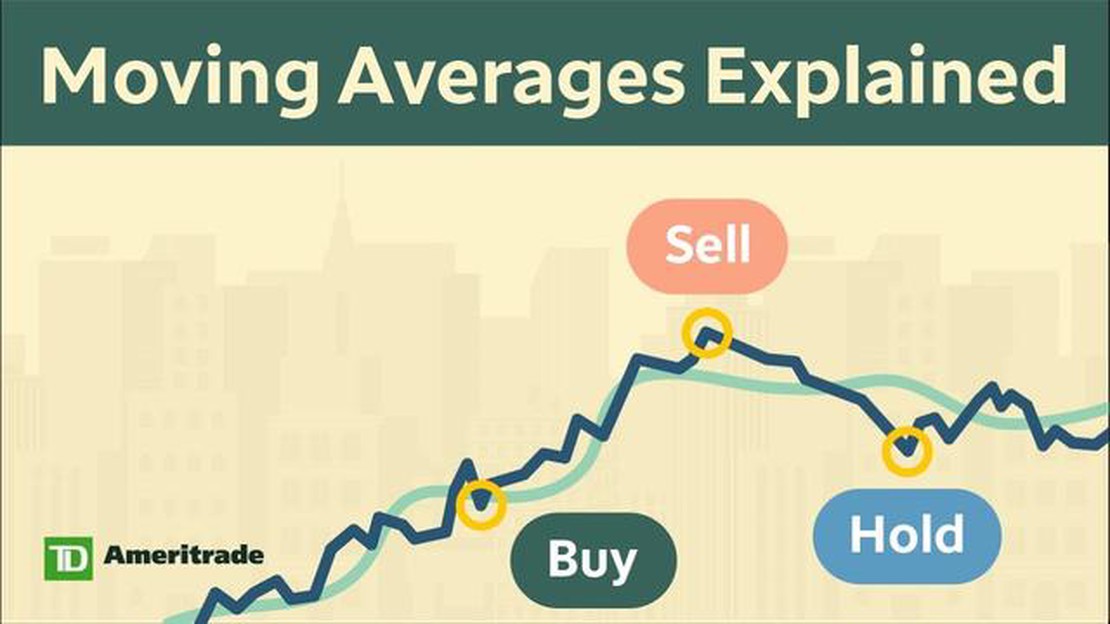
Understanding the 30 Day Moving Average of a Stock When it comes to investing in the stock market, understanding the 30 day moving average of a stock …
Read Article
Stock Symbol for Polar Night Energy Polar Night Energy is a renewable energy company that specializes in harnessing the power of the polar night. The …
Read Article


