


Understanding Relative Value Strategies CFA: A Comprehensive Guide
Understanding relative value strategies in CFA Relative value strategies are an important tool for investors looking to capitalize on pricing …
Read Article
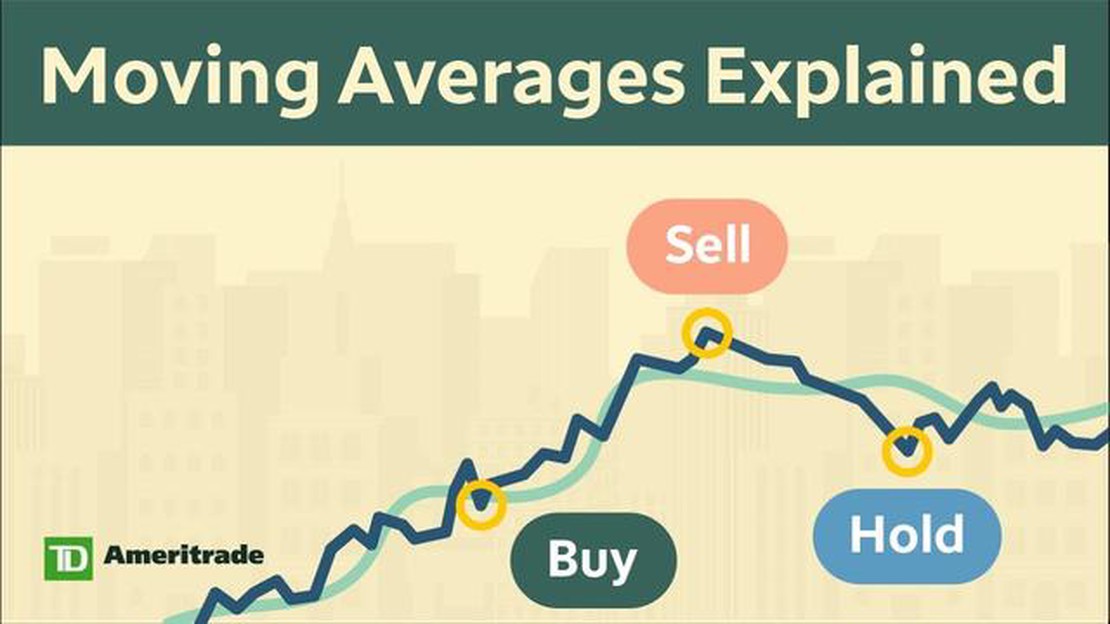
When it comes to investing in the stock market, understanding the 30 day moving average of a stock is crucial. The moving average is a powerful indicator that can help investors make informed decisions about buying or selling a particular stock. In this comprehensive guide, we will explore what the 30 day moving average is, how it is calculated, and how it can be used to analyze stock performance.
The 30 day moving average is a technical analysis tool that helps investors smooth out the fluctuations in stock price over a 30 day period. It is calculated by adding up the closing prices of a stock over the past 30 days and dividing the sum by 30. This moving average provides a clearer picture of the stock’s overall trend, as it eliminates short-term price fluctuations that may not be indicative of the stock’s true direction.
One of the main advantages of using the 30 day moving average is that it helps investors identify potential support and resistance levels. When the stock price crosses below the 30 day moving average, it could be a sign that the stock is losing momentum and that a downtrend may be imminent. On the other hand, when the stock price crosses above the 30 day moving average, it could be an indication that the stock is gaining momentum and that an uptrend may be on its way.
It is important to note that the 30 day moving average should not be used as the sole indicator for buying or selling a stock. It should be used in conjunction with other technical analysis tools and indicators to validate signals and confirm trends. By incorporating the 30 day moving average into your investment strategy, you can gain a better understanding of a stock’s performance and make more informed decisions to maximize your investment returns.
The 30 day moving average is a technical analysis tool used by traders and investors to analyze the price trend of a stock over a 30 day period. It is calculated by taking the average closing price of the stock over the past 30 trading days.
The moving average is used to smooth out short-term price fluctuations and identify the underlying trend of the stock. By taking the average of the stock’s closing prices over a specific time period, the moving average provides a clearer picture of the stock’s overall direction.
The 30 day moving average is a popular choice among traders and investors as it provides a balance between short-term and long-term trends. It is considered to be a good indicator of the stock’s overall price trend and can help traders make informed decisions about buying or selling the stock.
When the stock’s current price is above the 30 day moving average, it is considered to be in an uptrend, indicating that the stock is likely to continue rising in price. Conversely, when the stock’s current price is below the 30 day moving average, it is considered to be in a downtrend, indicating that the stock is likely to continue falling in price.
Traders and investors often use the 30 day moving average in conjunction with other technical indicators to confirm signals and make more accurate predictions about the stock’s future price movement. It is important to note that the 30 day moving average is just one tool among many and should not be relied upon solely when making investment decisions.

In summary, the 30 day moving average is a technical analysis tool used to analyze the price trend of a stock over a 30 day period. It helps to identify the overall direction of the stock’s price movement and provides traders and investors with valuable information for making informed decisions.
A moving average is a commonly used technical analysis tool that helps traders and investors identify the overall trend of a stock or other financial instrument over a specific time period. It is calculated by taking the average price of a stock over a predefined number of days, with each day’s price weighted equally.
Read Also: Is Ameritrade good for beginners? - Everything you need to know
The moving average is represented as a line on a chart, and it smooths out the price fluctuations to provide a clearer picture of the stock’s trend. By looking at the direction and slope of the moving average line, traders can determine whether a stock is in an uptrend, downtrend, or sideways trend.
There are different types of moving averages, but the most commonly used ones are the simple moving average (SMA) and the exponential moving average (EMA). The SMA calculates the average price over a specific number of periods, while the EMA assigns more weight to recent prices, making it more responsive to changes in price.
The choice of the time period for a moving average depends on the trader’s trading style and the stock being analyzed. Shorter time periods, such as the 30-day moving average, provide more timely signals but are also more sensitive to price fluctuations. Longer time periods, such as the 200-day moving average, are more stable but may generate delayed signals.
Traders often use moving averages in combination with other technical indicators, such as support and resistance levels or trendlines, to confirm trading signals or identify potential trading opportunities. For example, if the price of a stock crosses above its 30-day moving average, it may signal a bullish trend and provide a buying opportunity.
Overall, understanding the basics of a moving average is essential for traders and investors to analyze price trends and make informed decisions in the financial markets.
The 30 Day Moving Average is an important tool for technical analysts and traders in the stock market. It is used to smooth out price fluctuations and identify trends over a period of 30 trading days. Understanding the significance of the 30 Day Moving Average can help investors make informed decisions about buying, selling, or holding a stock.
Read Also: Understanding the 90% Percent Rule in Forex Trading
Here are four reasons why the 30 Day Moving Average is important:
| 1. Trend Identification | The 30 Day Moving Average helps identify the overall trend of a stock. When the price is consistently above the moving average, it indicates an uptrend. Conversely, when the price is consistently below the moving average, it indicates a downtrend. Traders can use this information to determine the direction of the stock and adjust their strategies accordingly. |
| 2. Support and Resistance Levels | The 30 Day Moving Average can act as a support or resistance level for a stock. In an uptrend, the moving average may provide support, preventing the price from falling below it. In a downtrend, the moving average may act as a resistance level, preventing the price from rising above it. Traders often look for these levels to make buy or sell decisions. |
| 3. Reversal Points | The 30 Day Moving Average can help identify potential reversal points in the stock market. When the price crosses above the moving average from below, it may signal a bullish reversal. Conversely, when the price crosses below the moving average from above, it may indicate a bearish reversal. These crossovers can be used as entry or exit points for trades. |
| 4. Risk Management | The 30 Day Moving Average can be used as a tool for risk management. Traders may set stop-loss orders below the moving average to limit potential losses. If the price falls below the moving average, it could signal a change in trend and the trader can exit the position to minimize losses. This strategy helps traders manage their risk and protect their capital. |

In conclusion, the 30 Day Moving Average is an important technical indicator used by traders and investors to analyze stock trends, identify support and resistance levels, spot potential reversals, and manage risk. By understanding the significance of the 30 Day Moving Average, traders can make better-informed decisions and increase their chances of success in the stock market.
The 30-day moving average of a stock is a technical indicator that calculates the average price of a stock over the past 30 trading days. It is commonly used by traders and investors to identify the overall trend of a stock and to make trading decisions.
The 30-day moving average is calculated by adding up the closing prices of a stock over the past 30 trading days and then dividing the sum by 30. Each day, the oldest closing price is dropped from the calculation and the newest closing price is added.
The purpose of using the 30-day moving average is to smooth out the short-term fluctuations in the price of a stock and to identify the general trend. It helps traders and investors to see the bigger picture and make more informed decisions about buying or selling a stock.
The 30-day moving average can be used in several ways to make trading decisions. For example, if the current price of a stock is above the 30-day moving average, it may indicate an uptrend and a potential buying opportunity. On the other hand, if the price is below the moving average, it may suggest a downtrend and a possible selling opportunity.
No, the 30-day moving average is just one of many technical indicators that traders and investors use to analyze stocks. It is often used in conjunction with other indicators, such as the 50-day moving average or the MACD, to confirm trends and make more reliable trading decisions.
The 30 Day Moving Average of a stock is the average closing price of the stock over the past 30 trading days. It is a technical indicator used by traders and investors to analyze the trend of a stock’s price over time.

Understanding relative value strategies in CFA Relative value strategies are an important tool for investors looking to capitalize on pricing …
Read Article
What is the Ideal Time Frame for Trading? When it comes to trading in the financial markets, choosing the right time frame is crucial. The time frame …
Read Article
How to Qualify for Foreign Exchange at Nedbank If you’re planning to travel abroad or conduct business with international partners, it’s important to …
Read Article
Understanding the Distinction between Subjective and Objective Trading When it comes to trading in the financial markets, there are two primary …
Read Article
Are options traded on ETFs? If you’re a seasoned investor or someone just starting to dip their toes into the world of trading, you may have heard …
Read Article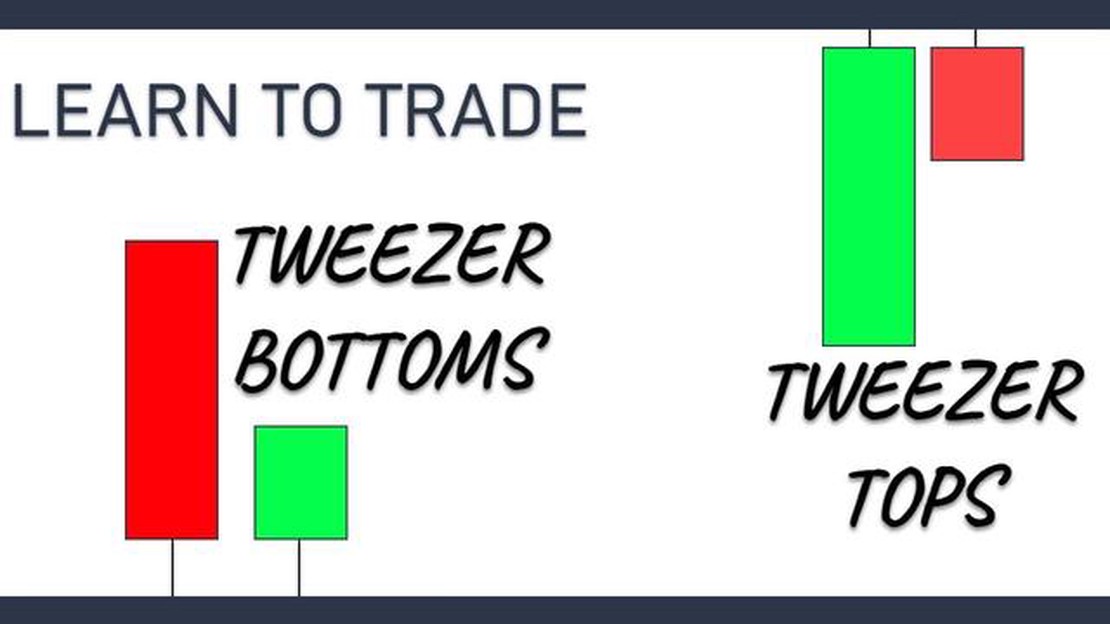
Understanding the Tweezer Top Pattern in Forex Trading When it comes to forex trading, understanding common candlestick patterns is essential for …
Read Article


