


Is a trading robot reliable? Learn the truth behind automated trading
Is a trading robot reliable? In today’s fast-paced financial markets, trading robots have become an increasingly popular tool for traders. These …
Read Article
If you are a trader using NinjaTrader, the Moving Average indicator is a powerful tool that can help you analyze and interpret market trends. In this comprehensive guide, we will delve into the intricacies of the Moving Average indicator and how you can leverage it to make informed trading decisions.
The Moving Average indicator is a technical analysis tool that calculates the average price over a specified period of time. It smooths out price fluctuations, allowing traders to identify market trends and potential entry and exit points. By plotting the Moving Average line on a price chart, traders can visually assess whether a market is in an uptrend, downtrend, or ranging.
The Moving Average indicator comes in different variations, including Simple Moving Average (SMA), Exponential Moving Average (EMA), and Weighted Moving Average (WMA). Each variation uses a unique calculation method, which may result in different sensitivity to market price changes. Understanding the differences between these variations and choosing the most suitable one for your trading strategy is crucial.
Using historical price data, the Moving Average indicator provides a smoothed line that reflects the average market sentiment. Traders often use the Moving Average as a dynamic support or resistance level, where price bounces off or breaks through. Additionally, the Moving Average crossover strategy, which involves the intersection of two Moving Averages of different periods, can generate buy or sell signals.
Whether you are a beginner trader or an experienced professional, mastering the Moving Average indicator in NinjaTrader will undoubtedly enhance your technical analysis skills. By understanding how to interpret Moving Average lines and how to integrate them into your trading strategy, you can gain a competitive edge in the financial markets.
A moving average indicator is a widely used technical analysis tool in trading. It helps to identify trends and potential entry and exit points by smoothing out price data over a specified period of time. By calculating the average price over a specific time frame, it eliminates some of the random fluctuations in price and provides a clearer picture of the overall trend.

The moving average indicator is called “moving” because it constantly updates as new data points are added. As each new data point is added, the oldest data point is dropped, resulting in a constantly updated average.
There are different types of moving averages, including simple moving averages and exponential moving averages. Simple moving averages give equal weight to each data point, while exponential moving averages give more weight to recent data points.
The moving average indicator is commonly used in combination with other technical indicators to confirm trends and generate trading signals. It can be used to identify support and resistance levels, as well as to determine potential trend reversals.
Overall, the moving average indicator is a powerful tool that can help traders make informed decisions in the market. It provides a smooth average of price data, allowing traders to better understand the current trend and potential future movements.
The Moving Average Indicator is one of the most widely used technical indicators in trading. It helps traders identify the underlying trend in a market and provides a smooth line that represents the average price over a specified period of time.
The indicator works by plotting the average price over a set number of periods, which can be days, weeks, or even minutes depending on the trader’s preference. As the name suggests, the moving average “moves” with each new period, updating the average price and reflecting the latest market conditions.
Read Also: Why Forex is Not Gambling: Key Differences and Benefits of Currency Trading
The Moving Average Indicator is useful because it helps filter out short-term price fluctuations and noise, allowing traders to focus on the overall trend. It can be used in various ways, such as identifying support and resistance levels, confirming trend reversals, and generating buy or sell signals.
There are different types of moving averages, including Simple Moving Average (SMA) and Exponential Moving Average (EMA). The Simple Moving Average calculates the average price over a set number of periods equally, while the Exponential Moving Average gives more weight to recent prices, making it more responsive to price changes.
Read Also: Is the stock market really risk-free? Exploring the reality of investment risks
Traders can choose the period length based on their trading style and the time frame they are trading. Shorter periods, such as 20 or 50, are commonly used for short-term trading, while longer periods, such as 100 or 200, are used for longer-term analysis.
When the price is above the moving average, it suggests an uptrend, and when the price is below the moving average, it indicates a downtrend. Traders often look for crossovers between different moving averages or between price and a moving average to determine potential buy or sell signals.
It is important to note that the Moving Average Indicator is a lagging indicator, meaning that it is based on past price data. It may not always accurately predict future price movements and should be used in conjunction with other indicators and analysis tools.
In conclusion, the Moving Average Indicator is a powerful tool for traders to identify trends and filter out noise in the market. Understanding its basics and different variations can help traders make more informed trading decisions and improve their overall trading strategy.
The Moving Average Indicator is a popular technical analysis tool that helps traders identify trends and potential entry and exit points in the market. It calculates the average price over a specified period of time and creates a line on the chart that represents this average.
To add the Moving Average Indicator to your NinjaTrader platform, you can go to the “Indicators” section in the control center, select “Moving Average” from the list of available indicators, and then adjust the settings according to your preference.

There are several types of Moving Averages, including Simple Moving Average (SMA), Exponential Moving Average (EMA), Weighted Moving Average (WMA), and Hull Moving Average (HMA). Each type has its own method of calculation and can be used in different trading strategies.
You can use the Moving Average Indicator to spot trends by observing the position of the price in relation to the moving average line. When the price is above the moving average, it indicates an uptrend, and when the price is below the moving average, it indicates a downtrend.
Yes, the Moving Average Indicator can be used for both short-term and long-term trading. Short-term traders may use shorter periods, such as 10 or 20, to capture more immediate trends, while long-term traders may use longer periods, such as 50 or 200, to identify broader trends in the market.
The Moving Average indicator in NinjaTrader is a tool that calculates the average price of a security over a specific period of time. It is used to identify trends and generate buy or sell signals based on the movement of the average line.
The Moving Average is calculated by adding up the closing prices of a security over a specific period of time and then dividing that sum by the number of periods. For example, a 10-day Moving Average is calculated by adding up the closing prices of the last 10 days and then dividing that sum by 10.

Is a trading robot reliable? In today’s fast-paced financial markets, trading robots have become an increasingly popular tool for traders. These …
Read Article
How to correctly pronounce bulguri Bulgur is a versatile grain that is commonly used in Middle Eastern and Mediterranean cuisines. It is a popular …
Read Article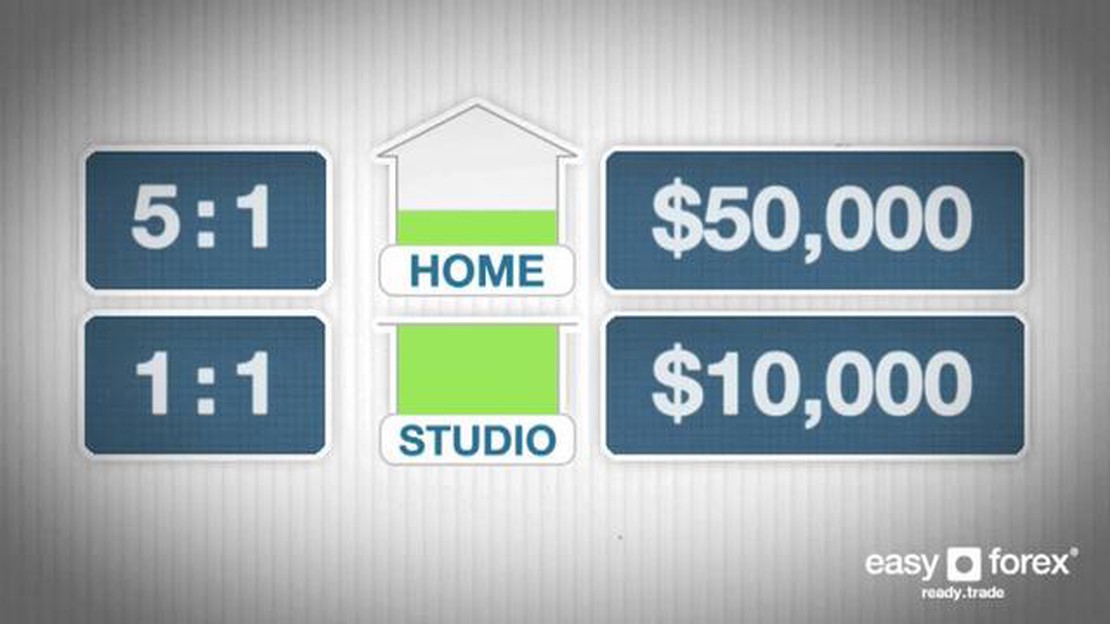
Maximum Leverage for easyMarkets When it comes to forex trading, leverage is a key feature that can greatly affect a trader’s ability to make profits. …
Read Article
Understanding the Distinction Between CEP and Stream Processing Complex Event Processing (CEP) and Stream Processing are two technologies that have …
Read Article
Cost of Trading Options on TD Ameritrade If you are looking to trade options on TD Ameritrade, it is important to understand the costs involved. …
Read Article
Understanding the Difference Between 50DMA and 200DMA Technical analysis is an essential tool for investors and traders to understand market trends …
Read Article


