


Understanding ES in Futures Trading: A Comprehensive Guide
Understanding ES in Futures Trading When it comes to futures trading, one of the most popular markets is the E-mini S&P 500 (ES) futures contract. It …
Read Article
Bollinger Bands are a popular technical analysis tool used by traders and investors to help identify potential price movements in the financial markets. Developed by John Bollinger in the 1980s, Bollinger Bands are based on the concept of volatility and provide a visual representation of price volatility over a given period of time.
The bands consist of three lines - a middle band, an upper band, and a lower band - that are plotted on top of a price chart. The middle band is typically a simple moving average, while the upper and lower bands are calculated using a specified number of standard deviations from the middle band.
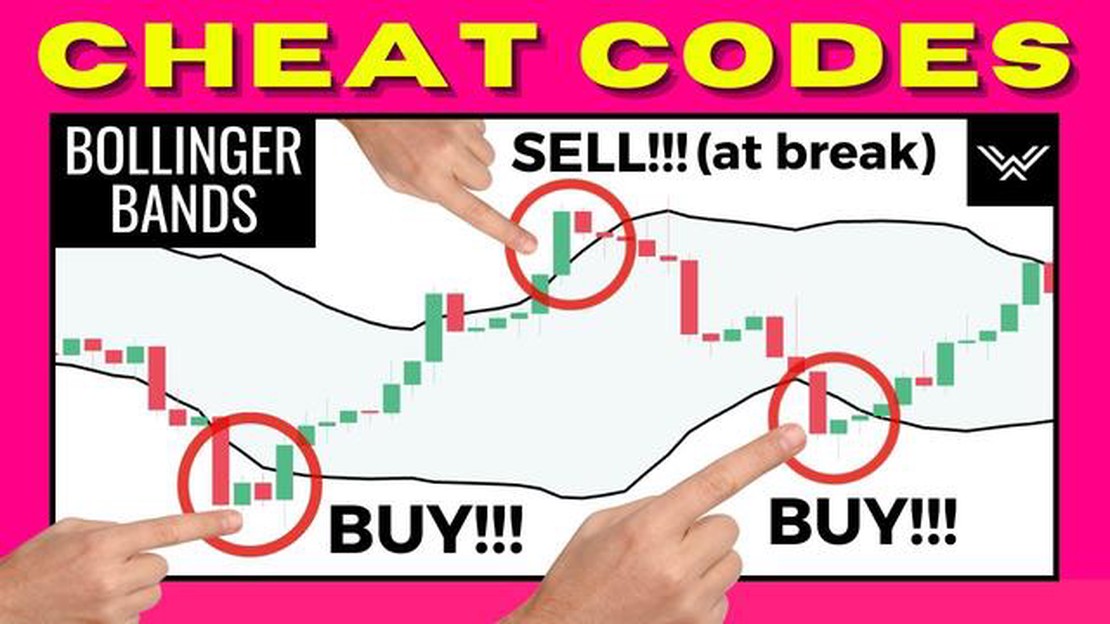
The main purpose of Bollinger Bands is to act as dynamic support and resistance levels for the price. When the price is trading near the upper band, it is considered overbought, and when it is trading near the lower band, it is considered oversold. Traders can use these levels to determine potential buy or sell signals.
Additionally, Bollinger Bands can also be used to measure the volatility of the market. When the bands are narrow, it indicates low volatility, and when the bands are wide, it indicates high volatility. This information can be helpful in identifying periods of consolidation and potential breakouts.
Overall, Bollinger Bands are a versatile tool that can be used to analyze price movements, identify trends, and generate trade signals. However, like any technical analysis tool, they should be used in conjunction with other indicators and analysis methods to make informed trading decisions.
Bollinger Bands are a popular technical analysis tool that is used to identify potential price reversals and volatility in financial markets. The bands consist of three lines: a middle line, an upper band, and a lower band. The middle line is usually a simple moving average (SMA) of the price, while the upper and lower bands are calculated based on the standard deviation of the price.
To calculate the upper and lower bands of the Bollinger Bands, you first need to calculate the middle line. This is done by taking the average of the closing prices over a specified time period. The most common time period used is 20 days, but it can be adjusted to suit different trading strategies.

Once you have the middle line, you can calculate the standard deviation of the closing prices over the same time period. This measures the volatility or the dispersion of the prices around the mean. The standard deviation is then multiplied by a factor to determine the width of the bands. The most common factor used is 2, but again, it can be adjusted according to individual preferences.
The upper band is calculated by adding the standard deviation multiplied by the factor to the middle line. This line represents the potential resistance level where prices are expected to revert downwards. On the other hand, the lower band is calculated by subtracting the standard deviation multiplied by the factor from the middle line. This line represents the potential support level where prices are expected to bounce back upwards.
The width of the Bollinger Bands is an important consideration for traders. Narrow bands indicate low volatility, while wide bands indicate high volatility. Traders often look for price breakouts when the bands are narrow, as it may signal the start of a new trend. Conversely, when the bands are wide, it suggests that price is nearing an extreme and a reversal could be imminent.
In conclusion, Bollinger Bands are a powerful tool for technical analysts as they provide insights into price volatility and potential price reversals. By calculating the upper and lower bands based on the standard deviation of the price, traders can identify key support and resistance levels that may influence future price movements.
As a popular technical analysis tool, Bollinger Bands are widely used by traders and investors to gauge market volatility and identify potential entry and exit points. By utilizing a combination of moving averages and standard deviation, Bollinger Bands create an envelope around the price action, providing valuable signals and indicators.
Read Also: Best indicators to use with MFI: A comprehensive guide
The primary function of Bollinger Bands is to determine whether prices are relatively high or low on a comparative basis. The bands consist of three lines plotted on a price chart: the middle band, which is a simple moving average, and an upper and lower band, which are based on a certain number of standard deviations away from the middle band.
A key aspect of Bollinger Bands is that they dynamically adjust to market conditions. When volatility is high, the bands widen, indicating that prices are more dispersed. Conversely, when volatility is low, the bands narrow, suggesting that prices are more consolidated.
Read Also: Understanding the Spread in Futures Trading: Everything You Need to Know
Traders commonly use Bollinger Bands to identify overbought and oversold conditions. When prices touch or move beyond the upper band, it may suggest that the market is overbought, and a potential reversal or downward correction could occur. On the other hand, when prices touch or move below the lower band, it may signal that the market is oversold, and a potential reversal or upward correction could take place.
In addition to overbought and oversold conditions, Bollinger Bands can also provide signals for potential trend reversals. When the price approaches or crosses the middle band, it may indicate a possible change in the current trend. For example, if prices have been trending upward and begin to touch or move below the middle band, it could suggest a shift from an uptrend to a downtrend.
Another widely used indicator derived from Bollinger Bands is the %B indicator. The %B indicator measures where the price is relative to the upper and lower bands. A reading above 1 indicates that the price is above the upper band, while a reading below 0 suggests that the price is below the lower band.
In conclusion, Bollinger Bands are a versatile tool that provides valuable signals and indicators for traders and investors. By understanding their functionality and how to interpret their signals, traders can make more informed decisions in the market.
Bollinger Bands are a technical analysis tool that consists of a middle band, an upper band, and a lower band. They are used to measure volatility and identify potential trend reversals.

Bollinger Bands are calculated using a simple moving average (typically 20 days) as the middle band, and two standard deviations are added and subtracted from the middle band to form the upper and lower bands.
The purpose of Bollinger Bands is to provide a visual representation of volatility and price levels relative to previous prices. They can be used to identify overbought and oversold conditions, as well as potential trend reversals.
Bollinger Bands can be used in trading to identify potential buy or sell signals. When the price moves near the upper band, it may indicate an overbought condition and a potential sell signal. Conversely, when the price moves near the lower band, it may indicate an oversold condition and a potential buy signal.
Yes, Bollinger Bands can be used in conjunction with other indicators to confirm trading signals. For example, a trader may use Bollinger Bands in combination with the Relative Strength Index (RSI) to identify potential trend reversals.
Bollinger Bands are a technical analysis tool that consists of a centerline and two price channels, which are plotted two standard deviations away from the centerline. They are used to measure the volatility and potential price reversal points in a financial instrument.
Bollinger Bands are calculated using a simple moving average (SMA) as the centerline and the standard deviation of price as the measure of volatility. The upper band is created by adding two standard deviations to the SMA, while the lower band is created by subtracting two standard deviations from the SMA.

Understanding ES in Futures Trading When it comes to futures trading, one of the most popular markets is the E-mini S&P 500 (ES) futures contract. It …
Read Article
Choose the Best Forex Demo Account for Your Trading Are you interested in Forex trading but not quite ready to dive into the real market? A Forex demo …
Read Article
What is a good exchange rate for CAD to USD? When it comes to exchanging currency, it’s important to find the best rate possible. For those looking to …
Read Article
What is the minimum share requirement for options? Options are a popular financial instrument that allows investors to have the right, but not the …
Read Article
Is Forex Trading Halal or Haram in Islam? Forex trading is a popular form of investment that involves the buying and selling of foreign currencies. …
Read Article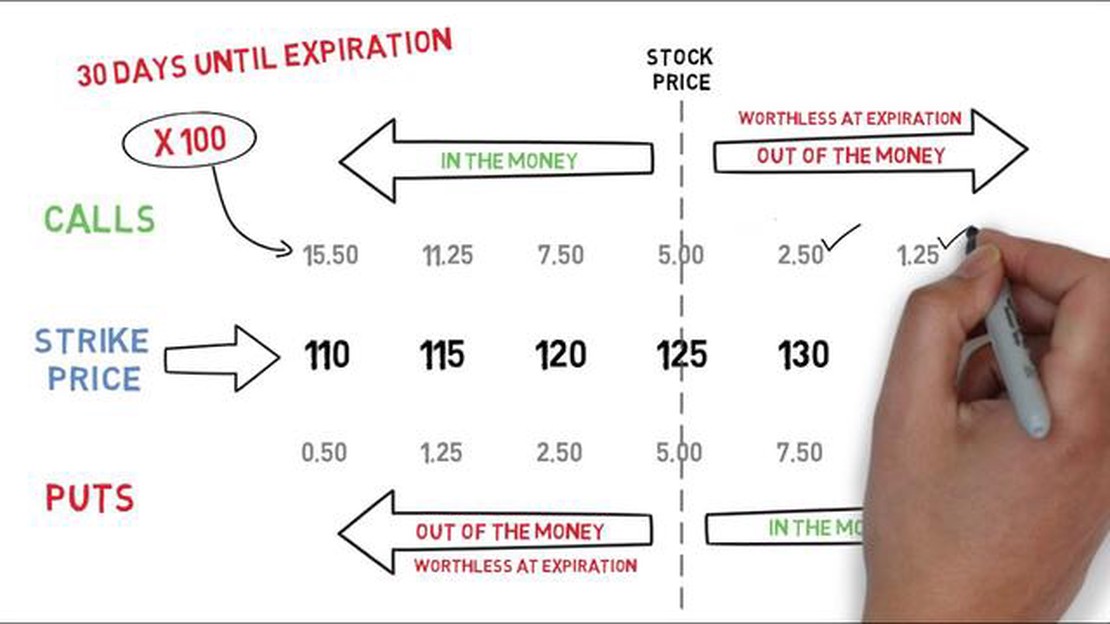
Calculating the Value of Stock Options: A Guide for Investors Stock options are a popular form of employee compensation that give individuals the …
Read Article


