

How to Calculate a 3 Month Moving Average: Step-by-Step Guide
Calculating the 3 Month Moving Average: A Step-by-Step Guide Calculating a 3 month moving average is a useful technique in data analysis and …
Read Article

When it comes to investing in stocks, having access to reliable financial information is crucial. One of the most valuable tools for understanding the current state of the stock market is a stock table. By interpreting the data contained in a stock table, investors can gain key insights into the performance, trends, and potential risks of various stocks. In this article, we will dive into what a stock table tells you and how to use this information to make informed investment decisions.
A stock table is a comprehensive snapshot of the stock market at a particular moment in time. It provides a wealth of information about individual stocks and the overall market. The table typically includes columns for the stock symbol, the company name, the current stock price, the change in price from the previous day, and the trading volume. Additionally, it may contain other relevant data such as the stock’s high and low prices for the day, the dividend yield, and the price-to-earnings ratio.
One of the key insights that can be gleaned from a stock table is the performance of a specific stock. By looking at the change in price column, investors can determine whether the stock has increased or decreased in value since the previous day. This information can help investors assess the short-term trend of a stock and gauge market sentiment towards it. Furthermore, the trading volume column reveals the number of shares that have been bought and sold, which can provide insight into the liquidity and popularity of a stock.
In addition to performance, a stock table can also indicate potential risks and opportunities. The high and low prices for the day can give investors an idea of the volatility and price range within which a stock is trading. A wide price range suggests higher volatility, which may present both opportunities for higher returns and risks of larger losses. Furthermore, the price-to-earnings ratio can help investors assess the relative valuation of a stock and whether it is overvalued or undervalued compared to its peers.

In conclusion, a stock table is a valuable tool that provides investors with crucial information about individual stocks and the overall market. By understanding the key insights that can be derived from a stock table, investors can make more informed investment decisions. Whether it’s assessing performance, identifying trends, or evaluating risks and opportunities, a stock table is an essential resource for anyone looking to navigate the complex world of stock investing.
Stock tables are a valuable tool for investors to make informed decisions about buying or selling stocks. They provide key information about a company’s financial performance, stock prices, and other relevant factors that can help investors assess the potential risks and rewards of investing in a particular stock.
Here are some key insights that you can gain from analyzing a stock table:
Read Also: Setting Bollinger Bands for Optimal Intraday Trading Strategies
By understanding and analyzing the information presented in a stock table, investors can gain valuable insights into a company’s financial health, market performance, and the potential risks and rewards of investing in its stock. This knowledge can help them make well-informed investment decisions and build a profitable investment portfolio.
Reading a stock table can be overwhelming for beginners, but once you understand the basics, you’ll be able to glean essential information about a company’s stock performance. Here are the key components of a typical stock table:
| Column | Description |
|---|---|
| Ticker Symbol | Abbreviation that represents the company’s stock on the stock exchange. |
| Company Name | The name of the company associated with the stock. |
| Stock Price | The current price of one share of the company’s stock. This is often displayed as two numbers, with the numbers before the decimal representing dollars and the numbers after the decimal representing cents. |
| Change | The difference in price between the current trading day and the previous trading day’s closing price. This can be displayed as both a percentage and a dollar amount. |
| Volume | The number of shares traded during the current trading day. |
| Average Volume | The average number of shares traded per day over a specific time period, often 30 days. |
| Market Cap | The total value of a company’s outstanding shares. It can give you a sense of the company’s size. |
These are the primary elements you’ll find in a stock table, although some tables may include additional information such as the 52-week high and low prices, earnings per share (EPS), and dividend yield.
Now that you know the basics of how to read a stock table, you can use this knowledge to make more informed investment decisions and understand the key insights provided by the table.
A stock table is a table that provides detailed information about the performance and trading activity of stocks on the stock market. It includes information such as the stock’s ticker symbol, the company name, the stock price, the trading volume, and other related data.
Read Also: Are Stock Options in a Private Company Worth Anything? Exploring the Potential Value and Risks
Reading a stock table requires understanding the different columns and values. The ticker symbol represents the unique abbreviation for a particular stock, the company name tells you the name of the company that the stock belongs to, the stock price indicates the current price of the stock, and the trading volume shows the number of shares traded on a given day. Additionally, other values such as the 52-week high and low, the dividend yield, or the price-to-earnings ratio can provide further insights.
A stock table can provide valuable insights about the stocks and the overall market. By looking at the stock prices, you can determine whether a particular stock is currently trading at a high or low price. The trading volume can indicate the level of investor interest in a stock. The 52-week high and low can show the range of prices that a particular stock has reached in the past year. Furthermore, information such as the dividend yield or the price-to-earnings ratio can give you an idea of the stock’s valuation and potential income.
Analyzing a stock table is important as it allows you to make informed decisions about buying or selling stocks. By examining the various data points in a stock table, you can evaluate the performance, trends, and potential risks of different stocks. This analysis can help you identify investment opportunities, understand the market conditions, and manage your portfolio more effectively.

Some common terms used in a stock table include the ticker symbol, which is a unique abbreviation for a stock, the stock price, which represents the current price of a stock, the trading volume, which indicates the number of shares traded in a given day, the 52-week high and low, which show the range of prices that a stock has reached in the past year, the dividend yield, which is the annual dividend payment divided by the stock price, and the price-to-earnings ratio, which compares the stock price to the company’s earnings per share.
A stock table is a table that provides information about different stocks and their trading activity. It includes details such as the stock’s ticker symbol, the company’s name, the stock’s last trading price, the change in price from the previous trading day, the trading volume, and other relevant information.
A ticker symbol is a unique series of letters that represents a particular stock on a stock exchange. It is used to identify the stock and is used by investors when buying, selling, or researching stocks. For example, the ticker symbol for Apple Inc. is AAPL.

Calculating the 3 Month Moving Average: A Step-by-Step Guide Calculating a 3 month moving average is a useful technique in data analysis and …
Read Article
Step-by-Step Guide: Option Trading in Forex Welcome to the beginner’s guide to option trading in forex! This step-by-step tutorial will help you …
Read Article
What is OANDA Currency Converter? OANDA Currency Converter is an online platform that provides users with a reliable and user-friendly way to convert …
Read Article
Reasons behind the low CAD to USD exchange rate The Canadian dollar (CAD) has been experiencing a low exchange rate against the United States dollar …
Read Article
The Ultimate Guide to Trading Indices: Discover the Best Strategies If you are interested in trading indices, you have come to the right place. In …
Read Article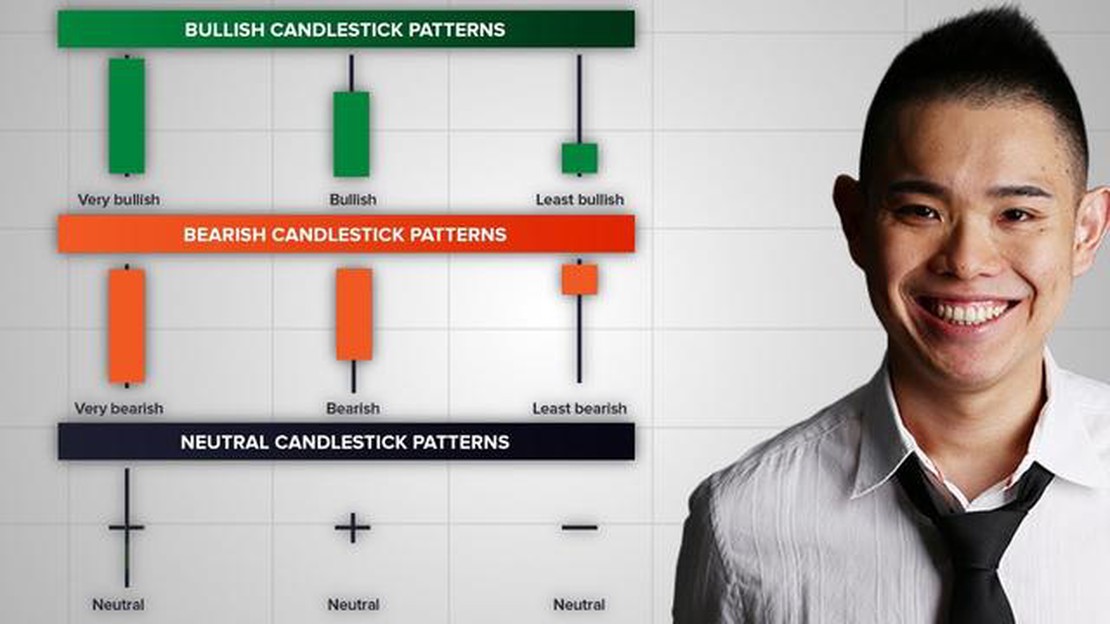
Understanding the 4-Hour Candle Pattern: A Comprehensive Guide When it comes to trading in the financial markets, understanding the patterns and …
Read Article


