


Is 1 100 Leverage Good for Beginners? - Pros and Cons Explained
Is 1 100 leverage good for beginners? Trading on the foreign exchange market can be an exciting and potentially lucrative venture for beginners. …
Read Article
When it comes to analyzing financial markets, investors and traders rely on a wide range of tools and indicators to make informed decisions. One such tool is the 50-day moving average (MA), which is a popular indicator used in technical analysis. The 50-day MA is a trend-following indicator that helps market participants identify the direction of a particular security or index over a specified period of time.
The 50-day MA is calculated by averaging the closing prices of a security or index over the past 50 trading days. By smoothing out short-term price fluctuations, the 50-day MA provides a clearer picture of the overall trend. It acts as a support or resistance level, depending on the price’s position relative to the MA. If the price is above the 50-day MA, it is considered bullish, indicating that the stock or index is in an uptrend. Conversely, if the price is below the 50-day MA, it is considered bearish, suggesting that the stock or index is in a downtrend.
One of the key benefits of using the 50-day MA is its ability to filter out noise and provide a more accurate view of the underlying trend. This can be particularly useful in volatile market conditions, where short-term price movements can often be misleading. By focusing on the longer-term trend, investors and traders can make better-informed decisions and avoid getting caught up in false signals.
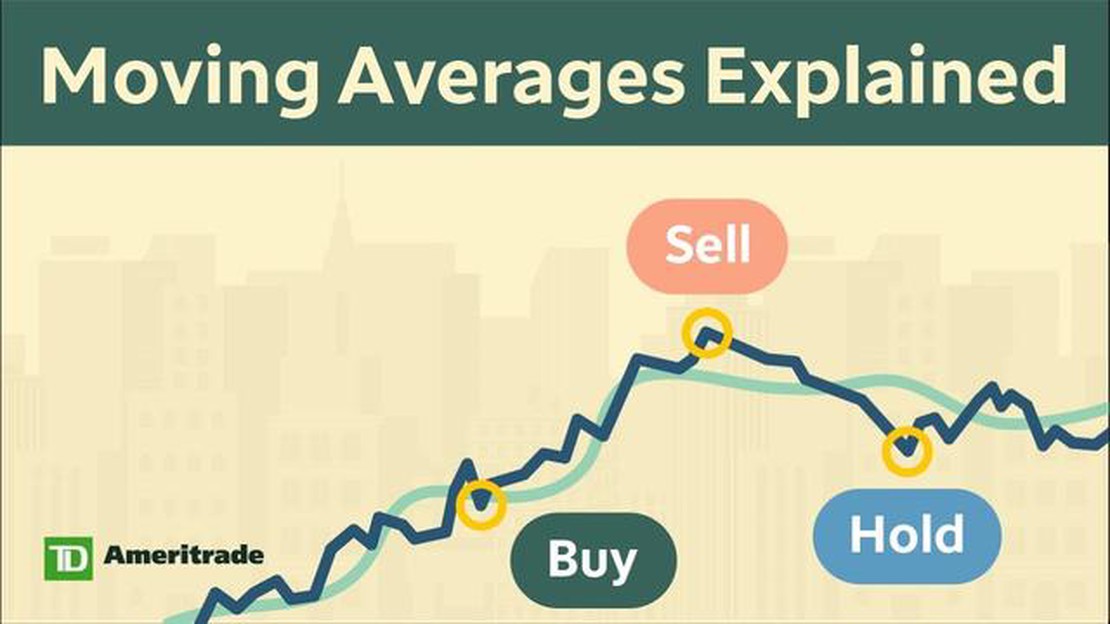
In addition to providing insights into the direction of the market, the 50-day MA can also be used as a tool for identifying potential entry and exit points. For example, some traders may use the cross of the price above or below the 50-day MA as a signal to buy or sell a security. Others may wait for a pullback to the 50-day MA before entering a position, as this can provide a more favorable risk-reward ratio.
Overall, the 50-day moving average is a valuable tool in financial analysis, providing investors and traders with a clearer picture of the market’s trend and potential entry/exit points. By understanding the importance of this indicator and incorporating it into their analysis, market participants can make more informed and profitable trading decisions.
A 50-day moving average is a technical analysis tool that helps traders and investors understand the overall trend of a stock or financial instrument over a specific period of time. It is calculated by taking the average closing price of the stock over the past 50 trading days.
The 50-day moving average is commonly used by market participants to identify key support and resistance levels. When the stock price crosses above the 50-day moving average, it is a bullish signal, indicating that the stock is potentially gaining momentum. On the other hand, when the stock price crosses below the 50-day moving average, it is a bearish signal, indicating that the stock may be losing momentum.
The 50-day moving average can also be used as a reference point for determining entry and exit points for trades. Traders often look for opportunities to buy stocks when they are trading above the 50-day moving average and sell stocks when they are trading below it.
Additionally, the 50-day moving average can be combined with other technical indicators to further enhance the accuracy of trading decisions. For example, traders may use the 50-day moving average in conjunction with the 200-day moving average to identify long-term trends.

Overall, the 50-day moving average is a valuable tool in financial analysis as it helps traders and investors understand the current trend of a stock or financial instrument and make more informed trading decisions.
Read Also: 10 Proven Tips for Consistently Profitable Forex Trading
Using the 50-day moving average in financial analysis offers several key benefits for traders and investors.
Firstly, the 50-day moving average helps to smooth out short-term price fluctuations and provide a clearer trend line. By taking the average of the past 50 days, it helps to filter out noise and provide a more reliable signal of the underlying trend. This can be particularly helpful in identifying the direction of the market and making informed trading decisions.
Secondly, the 50-day moving average can act as a support or resistance level for the price. When the price is trading above the 50-day moving average, it is often seen as a bullish signal, indicating that the trend is positive and the price is likely to continue rising. Conversely, when the price is trading below the 50-day moving average, it is often seen as a bearish signal, suggesting that the trend is negative and the price is likely to continue falling. Traders often use these levels to determine entry and exit points for their trades.
Another benefit of the 50-day moving average is its ability to provide early warning signals of potential trend reversals. When the price crosses above or below the 50-day moving average, it can indicate a shift in market sentiment and a possible change in trend direction. This can be useful for investors who want to stay ahead of major market movements and adjust their investment strategies accordingly.
Additionally, the 50-day moving average can be used to confirm other technical indicators or patterns. When the price aligns with other technical signals, such as a break of a key resistance level or a bullish chart pattern, and also crosses above the 50-day moving average, it can strengthen the validity of the signal and provide traders with more confidence in their analysis.
In conclusion, the 50-day moving average is a valuable tool in financial analysis. It helps to smooth out price fluctuations, acts as both support and resistance levels, provides early warning signals of trend reversals, and confirms other technical indicators. Traders and investors can benefit from incorporating the 50-day moving average into their analysis to make more informed and potentially profitable decisions.
The 50-day moving average is a powerful tool for trend analysis in financial markets. By smoothing out short-term price fluctuations, it allows traders and investors to better understand the overall direction of a security’s price movement.
One of the key benefits of using the 50-day moving average for trend analysis is that it helps to filter out noise and identify the underlying trend. This is achieved by calculating the average price of a security over a 50-day period, and plotting it on a chart. By focusing on the longer-term trend, traders can avoid getting caught up in short-term price movements that may not be indicative of the overall direction of the market.
Read Also: How to Determine the Fair Value of an ESOP: A Comprehensive Guide
The 50-day moving average can also help to confirm the strength of a trend. When a security’s price is consistently trading above its 50-day moving average, it indicates that the trend is bullish and that the security is in an uptrend. On the other hand, when a security’s price is consistently trading below its 50-day moving average, it indicates that the trend is bearish and that the security is in a downtrend.

Another advantage of using the 50-day moving average for trend analysis is that it can provide valuable support and resistance levels. Support levels are levels at which the price of a security tends to find support and reverse its downward trend, while resistance levels are levels at which the price of a security tends to find resistance and reverse its upward trend. By plotting the 50-day moving average on a chart, traders can easily identify these support and resistance levels, and use them to make more informed trading decisions.
Overall, the 50-day moving average is an essential tool for trend analysis in financial markets. It provides a clear and concise view of the overall direction of a security’s price movement, filters out short-term noise, confirms the strength of a trend, and identifies important support and resistance levels. By incorporating the 50-day moving average into their analysis, traders and investors can improve their ability to identify and capitalize on trends in the market.
The 50-day moving average is a popular technical analysis tool that calculates the average closing price of a security over the past 50 trading days. In other words, it smoothens out the price data and provides a visual representation of the stock’s price trend.
The 50-day moving average is important in financial analysis because it helps traders and investors identify the overall trend of a stock. It provides insights into whether the stock is in an uptrend or a downtrend and helps make informed decisions regarding buying or selling.
The 50-day moving average is calculated by adding up the closing prices of a security over the past 50 trading days and then dividing the sum by 50. This calculation provides a smoothed average price that reflects the stock’s price trend over a specific time period.
The significance of the 50-day moving average crossing is that it is considered a technical signal that indicates a change in the stock’s price trend. When the stock price crosses above the 50-day moving average, it is seen as a bullish signal, suggesting a potential uptrend. Conversely, when the price crosses below the 50-day moving average, it is seen as a bearish signal, suggesting a potential downtrend.
Yes, the 50-day moving average can be used for other financial instruments such as commodities, currencies, and market indices. The concept of the moving average can be applied to any security or asset that has a price data history. It can help identify trends and provide insights into potential price movements.
The 50-day moving average is a commonly used technical indicator in financial analysis. It smooths out price data over a 50-day period and helps identify trends in stock prices. It is used to determine the overall direction of the market and can be used to generate buy or sell signals.

Is 1 100 leverage good for beginners? Trading on the foreign exchange market can be an exciting and potentially lucrative venture for beginners. …
Read Article
Salary of a HSBC Trader in London: How Much Can They Earn? When it comes to working in the financial industry, one of the most coveted positions is …
Read Article
Forex Reserve of Bhutan: Key Facts and Figures Bhutan, a small mountainous country nestled in the Eastern Himalayas, is known for its rich cultural …
Read Article
Calculating Volume Adjusted Moving Average Introduction Table Of Contents Calculating Volume Adjusted Moving Average Understanding Volume Adjusted …
Read Article
Is UA undervalued? App stores are flooded with millions of apps, making it increasingly challenging for developers to stand out and acquire users. As …
Read Article
Trade Volume Indicator: How to Measure and Interpret It Trade volume is a crucial metric for investors and traders alike, as it provides insights into …
Read Article

