


When is the exchange rate updated?
What day is the exchange rate? The exchange rate is an important factor that affects international trade and financial transactions. It determines the …
Read Article

The Exponential Weighted Moving Average (EWMA) is a technical analysis indicator used to interpret momentum in financial markets. It is a variation of the simple moving average, with the difference that it assigns a greater weight to more recent data points.
The use of the EWMA helps traders and analysts identify trends and potential reversals in the price of financial instruments, such as stocks, currencies, and commodities. By weighting recent data more heavily, the EWMA provides a more accurate representation of the current market sentiment.
One of the advantages of the EWMA is its responsiveness to market changes. Because it assigns more weight to recent data, it quickly adjusts to new information, helping traders identify potential opportunities for profit. Additionally, the EWMA helps filter out noise and smooths out the price movements, making it easier to spot meaningful trends.
Traders often use the EWMA in conjunction with other indicators and trading strategies to confirm signals or generate trading ideas. By combining the EWMA with other technical indicators, traders can increase the accuracy of their analysis and make more informed trading decisions.
“The EWMA is a powerful tool in technical analysis, providing traders with valuable insights into market momentum. By understanding how to interpret the EWMA, traders can gain a better understanding of price movements and make more accurate predictions about future market conditions.”
The Exponential Weighted Moving Average (EWMA) Momentum is a technical indicator used in financial analysis to measure the velocity and strength of price movements. It is a type of moving average that assigns more weight to recent data points, while decreasing the weight of older data points. This makes it more responsive to recent price changes and reduces the lag often associated with traditional moving averages.
The EWMA Momentum is calculated by taking the difference between the current period’s closing price and the previous period’s closing price, and then multiplying it by a weight. The weight is determined by a smoothing factor, which is typically set between 0 and 1. A higher smoothing factor assigns more weight to recent data points, while a lower smoothing factor assigns more weight to older data points.
The EWMA Momentum is often used as a trend-following indicator, helping traders and analysts identify buying and selling signals based on the direction and magnitude of price movements. When the EWMA Momentum is positive and increasing, it suggests an uptrend, indicating that prices are rising at an accelerating rate. Conversely, when the EWMA Momentum is negative and decreasing, it suggests a downtrend, indicating that prices are falling at an accelerating rate.
This momentum indicator can also be used to confirm the strength of a trend or identify potential market reversals. A strong upward trend is typically accompanied by a positive and increasing EWMA Momentum, while a strong downward trend is typically accompanied by a negative and decreasing EWMA Momentum. A divergence between the direction of price and the EWMA Momentum may indicate a potential trend reversal.
Read Also: Can I quit after vesting? - All you need to know
The Exponential Weighted Moving Average Momentum is a versatile tool that can be applied to various financial markets and timeframes. It can be used in conjunction with other technical indicators and analysis techniques to make more informed trading decisions and improve market timing.
The Exponential Weighted Moving Average Momentum (EWMA) is an important tool in technical analysis and financial forecasting. It provides a way to smooth out data trends and identify potential changes in market direction.
Read Also: How much is $100 in Jamaican? | Convert USD to JMD
There are several key reasons why the EWMA momentum is important:
In conclusion, the Exponential Weighted Moving Average Momentum is important because it provides a more accurate representation of recent data, responds faster to market changes, helps identify trend reversals, can be applied in various timeframes, and can be integrated with other technical indicators. By incorporating the EWMA into their trading strategies, traders can make more informed decisions and potentially improve their overall trading performance.
Exponential Weighted Moving Average (EWMA) momentum is a technical indicator used in technical analysis to identify the strength and direction of a trend in a stock or other financial instrument. It is calculated by applying a weight to each data point based on its recency, with more recent data points given greater importance.
To calculate EWMA momentum, you need to first calculate the EMA of the prices over a specific time period. This is done by applying a weight to each data point, with the most recent data point given the highest weight. Then, you calculate the difference between the current EMA value and the EMA value n periods ago. This difference is the EWMA momentum.

EWMA momentum is significant because it provides a way to identify the strength and direction of a trend in a more responsive and accurate manner than traditional moving averages. By giving greater weight to more recent data, EWMA momentum is able to quickly adapt to changes in market conditions.
EWMA momentum can be used in trading as a signal to enter or exit trades. When the momentum is positive, it indicates a strong uptrend, and traders may consider buying. When the momentum is negative, it indicates a strong downtrend, and traders may consider selling. Additionally, crossover signals can be generated when the momentum crosses above or below a certain threshold.
EWMA momentum can be used for a wide range of financial instruments, including stocks, forex, commodities, and cryptocurrencies. However, it is important to note that different instruments may exhibit different characteristics, so it is always important to consider the specific nature of the instrument being traded when using EWMA momentum.
The Exponential Weighted Moving Average (EWMA) momentum is a technical analysis indicator that measures the rate of change of an asset’s price over a certain period of time. It provides a smoothed line that can help traders identify trends and potential trading opportunities.

What day is the exchange rate? The exchange rate is an important factor that affects international trade and financial transactions. It determines the …
Read Article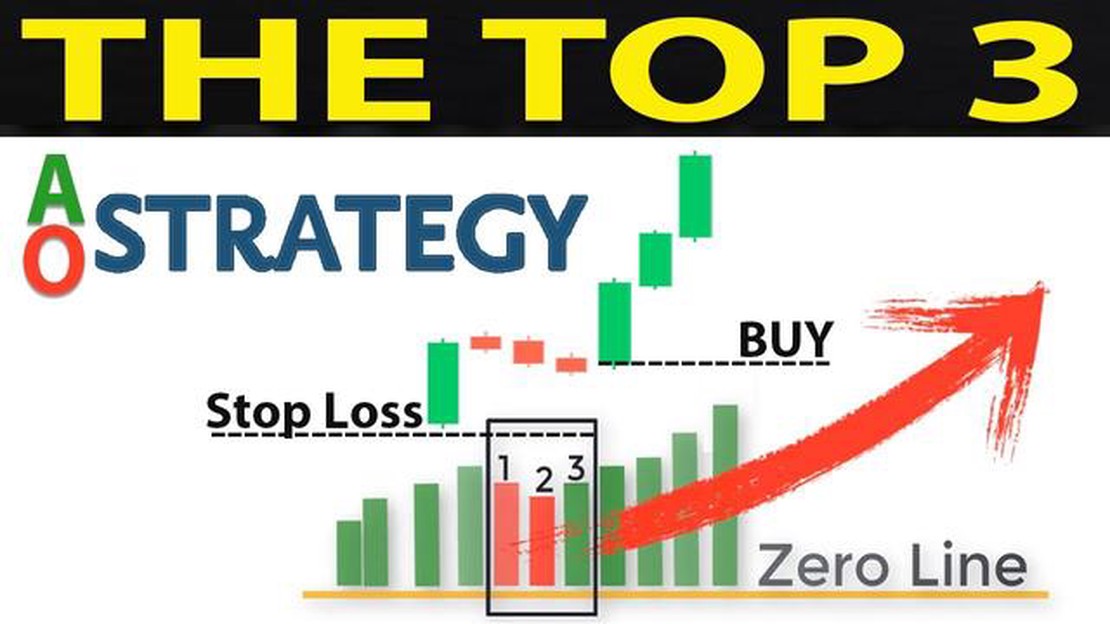
Understanding the Functioning of an Awesome Oscillator The Awesome Oscillator is a technical analysis tool used by traders to identify potential …
Read Article
Understanding OpenTable’s Additional Seating Options OpenTable has revolutionized the way people make restaurant reservations. With just a few clicks, …
Read Article
Salary of Chefs in Cyprus: What is the Average Pay? Being a chef has always been associated with passion and creativity in the culinary arts. But …
Read Article
Is Forex Trading Legal in India? Forex trading, also known as foreign exchange trading, has become increasingly popular in India in recent years. …
Read Article
Is a Career in Option Trading a Viable Option? Option trading, a derivative of the stock market, has gained popularity in recent years as a potential …
Read Article


