


Is Forex Trading Closing? What You Need to Know
Is Forex Trading Coming to an End? In recent months, there has been rising speculation about the potential closure of the forex trading market. As one …
Read Article
In the world of finance and data analysis, two commonly used statistical tools are moving averages and linear regression. While they may seem similar at first glance, a closer examination reveals distinct differences in their methodologies and applications.
A moving average is a technique that helps smooth out fluctuations in data. It is calculated by taking the average of a specific number of data points over a given period of time. Essentially, it creates a “moving” window or interval that slides along the dataset, calculating the average for each window. This helps analysts identify trends or patterns in data while eliminating short-term noise or random fluctuations.
On the other hand, linear regression is a statistical model used to analyze the relationship between two variables: a dependent variable and one or more independent variables. It aims to find the best-fit line that can explain the relationship between the variables. Linear regression calculates the slope and intercept of this line, allowing analysts to make predictions or draw conclusions based on the observed data.
While both moving averages and linear regression provide insights into trends and patterns, their approaches and use cases differ. Moving averages are more suited for identifying short-term trends or cyclical patterns in data. It is commonly used in technical analysis to analyze stock prices, currency exchange rates, or other time series data. On the other hand, linear regression is better suited for analyzing the overall relationship between variables and making predictions. It is commonly used in finance, economics, and social sciences to study the impact of variables on an outcome.
In summary, moving averages and linear regression are statistical tools that serve different purposes in data analysis. Moving averages help smooth out fluctuations and identify short-term trends, while linear regression focuses on analyzing the relationship between variables and making predictions. Understanding the distinction between these two tools is crucial for accurate data interpretation and informed decision-making.
When it comes to analyzing data trends, moving average and linear regression are two commonly used statistical techniques. While they both serve the purpose of predicting future values based on past data, they differ in their underlying mathematical principles and applications.

A moving average is a method used to smooth out fluctuations in data and identify underlying trends. It calculates the average of a specified number of data points over a given period of time, and then uses this average as the predicted value for the next data point. The moving average can be simple, weighted, or exponential, depending on the weights assigned to different data points within the period. This technique is particularly useful in financial markets for identifying trends and predicting future price movements.
On the other hand, linear regression is a statistical model that aims to find the best-fitting line to a set of data points. It assumes a linear relationship between the independent variable (input) and the dependent variable (output) and estimates the parameters of the line to minimize the sum of squared differences between the predicted and actual values. The resulting line can then be used to make predictions for new data points. Linear regression is widely used in various fields such as economics, social sciences, and engineering to understand the relationship between variables and make forecasts.
While moving average focuses on capturing short-term trends by smoothing out fluctuations, linear regression aims to identify the overall relationship between variables and make long-term predictions. Moving average is often used when there is a need to reduce noise and highlight underlying patterns in data. On the other hand, linear regression is used when there is a need to quantify the relationship between variables and make precise predictions. Both techniques have their strengths and weaknesses, and the choice between them depends on the specific problem at hand.
| Moving Average | Linear Regression |
|---|---|
| Smoothing out fluctuations | Best-fitting line |
| Predict short-term trends | Quantify relationship between variables |
| Reduce noise | Make precise predictions |
| Identify underlying patterns | Make long-term predictions |
Read Also: Taxation rules for forex traders in UAE: Do they have to pay taxes?
In conclusion, moving average and linear regression are both valuable tools for data analysis and prediction. By understanding their differences and applications, analysts can choose the most appropriate technique for their specific needs and improve decision-making. Whether it’s identifying short-term trends or quantifying relationships between variables, these techniques provide valuable insights into the behavior of data.
The moving average and linear regression are two widely used statistical tools in finance and data analysis. Although they both involve the analysis of data over a period of time, they serve different purposes and have distinct characteristics.
Read Also: Become a Successful Weekly Trader: Tips, Strategies, and Benefits
Firstly, moving average is a simple and popular method to smooth out fluctuations in data and identify trends. It calculates the average of a set of data points over a specified time period to create a series of equally spaced averages. This helps to eliminate short-term fluctuations and highlight the long-term trend. Moving averages are commonly used in technical analysis to identify potential support and resistance levels and generate buy/sell signals.
On the other hand, linear regression is a statistical technique used to identify and quantify the relationship between two variables. It aims to find the best-fitting straight line through a set of data points by minimizing the sum of the squared differences between the observed and predicted values. The resulting line provides an estimate of the average change in the dependent variable for a one-unit change in the independent variable. Linear regression is commonly used to forecast future values based on historical data and analyze the strength and direction of the relationship between variables.
In summary, while moving average focuses on smoothing out data and identifying trends, linear regression aims to model the relationship between variables and make predictions. Moving average is particularly useful for identifying long-term trends and filtering out noise, while linear regression provides a more precise analysis of the relationship between variables and can be used for forecasting future values. Both techniques have their own strengths and applications, and their choice depends on the specific objective of the analysis.
A moving average is a statistical calculation that is used to analyze data points by creating a series of averages of different subsets of the full data set.

A moving average is a simple way to smooth out data and identify trends, while linear regression is a more sophisticated technique that can be used to model the relationship between two variables.
A moving average can help to remove random variations in data and provide a clearer picture of underlying trends. It can also be useful for making short-term predictions.
Yes, a moving average can be used to make short-term predictions based on past data points. However, it is important to note that the accuracy of these predictions may vary depending on the specific characteristics of the data.
Linear regression can be useful when you want to model the relationship between two variables and make predictions based on that relationship. It is particularly effective when the relationship between the variables is non-linear or when you have a large amount of data to work with.

Is Forex Trading Coming to an End? In recent months, there has been rising speculation about the potential closure of the forex trading market. As one …
Read Article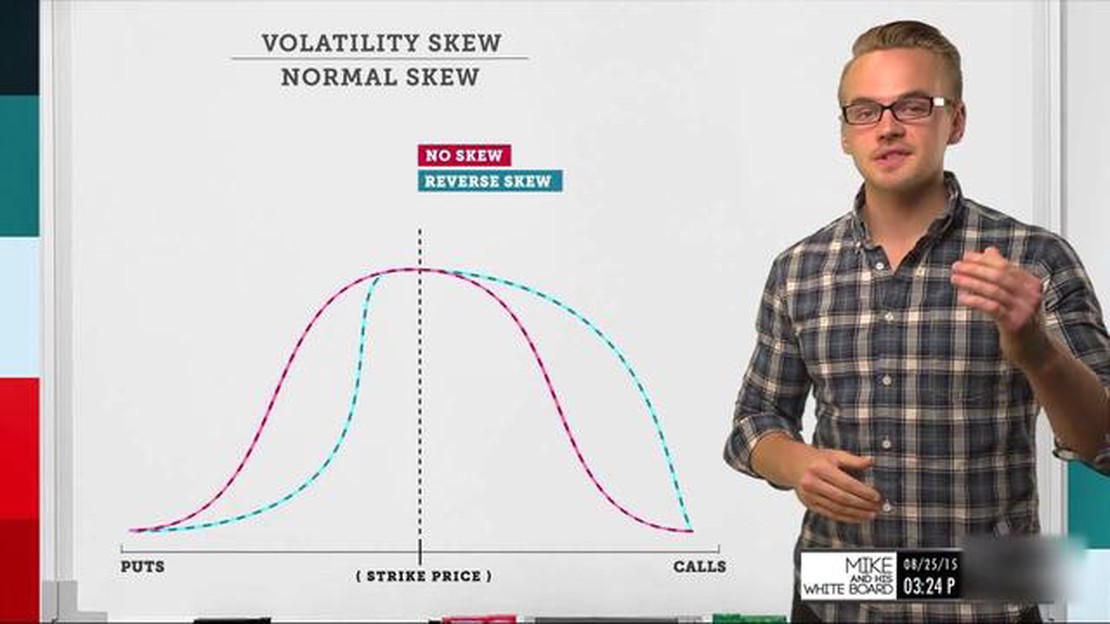
What is the skew of options pricing? Options trading is a complex financial instrument that involves buying and selling contracts based on the future …
Read Article
Understanding the Purpose of DD2345: A Comprehensive Guide The DD2345 form is an important tool used by individuals and organizations who wish to …
Read Article
Best Options Trading Platform in India When it comes to options trading in India, it’s important to choose the right platform that suits your needs …
Read Article
Buy Foreign Currency in Hyderabad: Your Complete Guide If you are planning a trip abroad from Hyderabad, one of the important things you need to take …
Read Article
Why do executives receive stock-based compensation? Stock compensation has become a common practice for many companies around the world, especially …
Read Article


