


Understanding User System Interface: Definition, Components, and Importance
Understanding the User System Interface: Key Concepts and Functionality The User System Interface (USI) plays a vital role in the interaction between …
Read Article
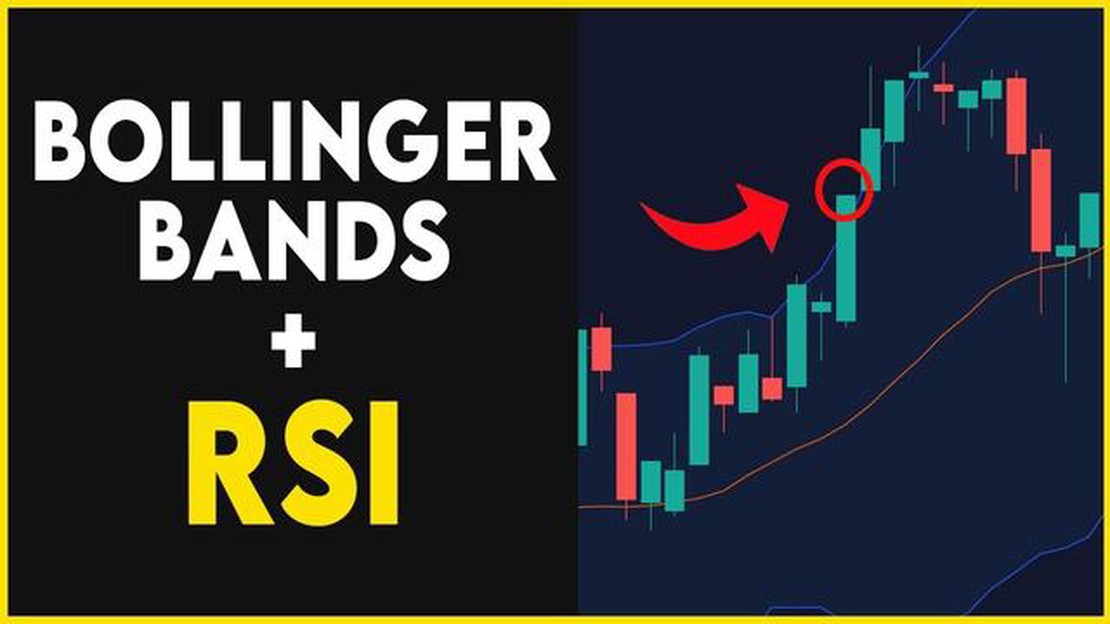
Bollinger Bands are a popular technical analysis tool used by traders to identify potential price breakouts and trends in the financial markets. They were developed by John Bollinger in the 1980s and have since become an essential tool in the toolkit of many traders. Bollinger Bands consist of three lines: the upper band, the lower band, and the middle band.
The upper band is calculated by adding two standard deviations to the middle band, while the lower band is calculated by subtracting two standard deviations from the middle band. The middle band is usually a simple moving average of the asset’s price over a specified period of time. The standard deviation is a statistical measure of the asset’s volatility.
One of the key uses of Bollinger Bands is to identify periods of low volatility, represented by a narrow gap between the upper and lower bands. This indicates that the asset’s price is trading within a relatively tight range and can potentially signal a breakout in either direction. Conversely, a wide gap between the bands indicates high volatility and the potential for a trend reversal.
In addition to using Bollinger Bands to identify potential breakouts, traders also use the different levels of the bands to make trading decisions. When the price touches or crosses the upper band, it may indicate an overbought condition, suggesting that the price may start to decline. On the other hand, when the price touches or crosses the lower band, it may indicate an oversold condition, suggesting that the price may start to rise.
By understanding the different levels of Bollinger Bands and how they can be used in conjunction with other technical analysis tools, traders can gain valuable insight into the potential direction and strength of price movements in the financial markets.
The Bollinger Bands indicator is a popular tool used by traders to analyze price volatility and potential trading opportunities. It consists of three lines: the middle band and two outer bands, which are derived from a simple moving average and standard deviations. Understanding the different levels of Bollinger Bands can help traders identify key price levels and potential reversals.
The middle band, often represented by a simple moving average (SMA), is the central line of the Bollinger Bands. It provides a reference point for the average price over a specified time period. Traders often use the middle band as a support or resistance level. When the price is above the middle band, it may indicate an uptrend, while a price below the middle band may suggest a downtrend.

The upper band is calculated by adding a specified number of standard deviations to the middle band. It represents the potential overbought level or resistance level in an uptrend. When the price reaches or exceeds the upper band, it may be an indication that the price has reached a temporarily high level and could reverse. Traders often look for bearish signals or potential selling opportunities when the price is near the upper band.
The lower band is calculated by subtracting a specified number of standard deviations from the middle band. It represents the potential oversold level or support level in a downtrend. When the price reaches or falls below the lower band, it may indicate that the price has reached a temporarily low level and could reverse. Traders often look for bullish signals or potential buying opportunities when the price is near the lower band.
Another important aspect of Bollinger Bands is the volatility squeeze. This occurs when the distance between the upper and lower bands becomes narrow, indicating a period of low volatility. Traders often interpret this as a precursor to a significant price move. Once the narrow range is broken, it can signal the start of a trend or a breakout. Traders may use this as a signal to enter a trade or adjust their existing positions.
Bollinger Band Width is a technical indicator derived from Bollinger Bands that measures the difference between the upper and lower bands. It provides a visual representation of volatility, with wider bands indicating higher volatility and narrower bands indicating lower volatility. Traders often use Bollinger Band Width to identify periods of high volatility and to anticipate potential breakouts or trend reversals.
Read Also: Exploring the Effectiveness of Candlestick Patterns in the Stock Market
By understanding the different levels of Bollinger Bands, traders can gain valuable insights into price volatility, potential support and resistance levels, as well as potential trend reversals. It is important to use Bollinger Bands in conjunction with other technical analysis tools and indicators to make informed trading decisions.
The upper band of the Bollinger Bands is an important indicator for traders to understand. It represents the upper limit of price movements based on the standard deviation of the asset’s price over a specified period of time. When the price of the asset approaches or reaches the upper band, it is generally considered overbought, indicating that the asset’s price may be due for a reversal or a pullback.
Read Also: How much is $1 USD in PHP? Current exchange rate
Traders often use the upper band level to identify potential selling opportunities. When the price touches or crosses the upper band, it suggests that the asset’s price has reached a point of resistance and that selling pressure may increase. This can be a signal for traders to sell their positions or to take profits.
However, it is important to note that the upper band level alone is not enough to make trading decisions. Traders should also consider other indicators and perform additional analysis to confirm the potential reversal or pullback. This can include checking for bearish candlestick patterns, monitoring volume, or using other technical indicators.
Additionally, it is important to consider the overall trend of the asset’s price when interpreting the upper band level. If the price is in a strong uptrend, it is possible that the price may continue to move higher and reach the upper band without a significant pullback. Conversely, if the price is in a downtrend, the upper band may act as a resistance level, preventing the price from moving higher.
In summary, the upper band level of the Bollinger Bands is a valuable tool for traders to identify potential selling opportunities. However, it should be used in conjunction with other indicators and analysis to make informed trading decisions. By understanding the interpretation of the upper band level, traders can enhance their trading strategies and improve their overall success.

Bollinger Bands are a technical indicator that consists of a simple moving average and two standard deviation lines. They are used to measure volatility and identify potential areas of support or resistance in a security’s price.
The upper Bollinger Band is calculated by adding two standard deviations to the simple moving average, while the lower Bollinger Band is calculated by subtracting two standard deviations from the simple moving average.
When the price touches the upper Bollinger Band, it can be a signal that the security is overbought and due for a potential reversal or pullback.
One way Bollinger Bands can help identify trend reversals is by looking for price divergence. If the price is making higher highs, but the Bollinger Bands are making lower highs, it could be a sign that the uptrend is losing momentum and a reversal may be imminent.
Yes, Bollinger Bands can be a useful tool for day traders. They can help identify potential entry and exit points, as well as provide insight into market volatility.
Bollinger Bands are a technical analysis tool that consists of a centerline and two price channels above and below it. The centerline represents a moving average, typically the 20-day simple moving average, and the price channels are based on the standard deviation of the underlying security’s price.

Understanding the User System Interface: Key Concepts and Functionality The User System Interface (USI) plays a vital role in the interaction between …
Read Article
SGX Trading: A Step-by-Step Guide Welcome to our beginner’s guide on how to trade on the Singapore Exchange (SGX). Whether you’re new to trading or …
Read Article
Is Kraken legit or not? With the increasing popularity of cryptocurrency, more and more people are turning to crypto exchanges to buy and sell digital …
Read Article
Reasons why option selling is not profitable Option selling may seem like an attractive investment strategy in the financial markets, offering the …
Read Article
Understanding the 26 Moving Average: A Comprehensive Guide In the world of technical analysis, moving averages are a popular tool used by traders to …
Read Article
Is it possible to become a millionaire through forex trading? Forex trading has gained immense popularity in recent years, with many individuals …
Read Article


