


Is Joining IFA Free? Discover the Membership Options
Is joining IFA free? If you are considering joining the International Finance Association (IFA), you may be wondering whether there is a cost …
Read Article
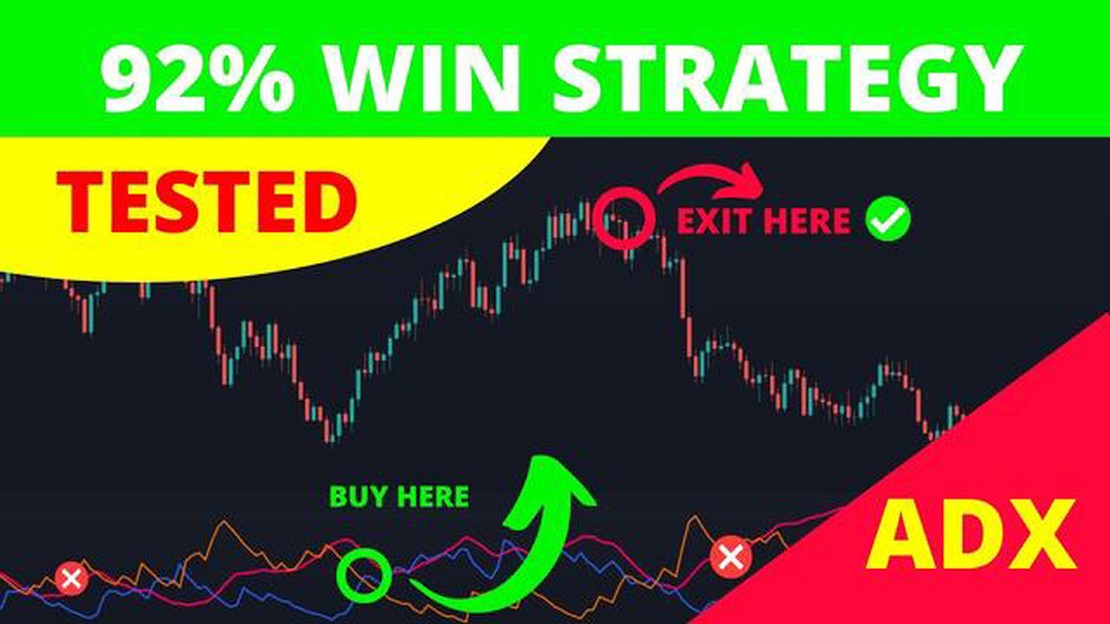
The Average Directional Index (ADX) is a popular technical indicator used by traders to determine the strength of a trend. It was developed by Welles Wilder in the late 1970s and has since become an essential tool for both novice and experienced traders. The ADX indicator measures the strength and direction of a trend, which can be invaluable for making informed trading decisions.
The ADX indicator is displayed as a line on a price chart, with values ranging from 0 to 100. A higher ADX value suggests a stronger trend, while a lower value indicates a weaker trend or a ranging market. Traders often use the ADX in combination with other indicators to confirm the presence of a trend and to avoid false signals.
One of the key features of the ADX indicator is its ability to differentiate between trending and ranging markets. When the ADX line is above a certain threshold, typically set at 25 or 30, it suggests the presence of a strong trend. Traders may consider entering a trade in the direction of the trend when the ADX is above this threshold. Conversely, when the ADX line is below the threshold, it indicates a weak trend or a ranging market, suggesting that it may be better to avoid entering trades.
Another important aspect of the ADX indicator is its ability to indicate the strength of a trend. A higher ADX value suggests a stronger trend, while a lower value suggests a weaker one. Traders can use this information to determine whether to stay in a trade or exit it. For example, if the ADX value is increasing, it suggests that the trend is gaining strength, and traders may choose to stay in the trade. On the other hand, if the ADX value is decreasing, it suggests that the trend is losing strength, and traders may consider exiting the trade to lock in their profits.
The Average Directional Movement Index (ADX) is a technical indicator that helps traders determine the strength of a trend and whether it is worth trading. It was developed by J. Welles Wilder and it is used to identify both trending and ranging markets.
The ADX indicator consists of three lines: the ADX line, the +DI line, and the -DI line. The ADX line measures the strength of the trend, while the +DI line measures the strength of bullish movements, and the -DI line measures the strength of bearish movements.
The ADX line ranges from 0 to 100, with readings below 20 indicating a weak trend and readings above 50 indicating a strong trend. When the ADX line is above 50, it suggests that the trend is getting stronger, while readings below 20 indicate a lack of trend.
The +DI line and -DI line are plotted together with the ADX line. When the +DI line crosses above the -DI line, it suggests a bullish trend, and when the -DI line crosses above the +DI line, it suggests a bearish trend.
Traders can use the ADX indicator to identify potential trade opportunities. For example, if the ADX line is above 50 and both the +DI line and -DI line are moving in the same direction, it could indicate a strong trend and traders might consider entering a trade in that direction.
It is important to note that the ADX indicator does not provide information about the direction of the trend, only its strength. Therefore, it is often used in conjunction with other technical indicators or price action analysis to determine when to enter or exit a trade.

The Average Directional Index (ADX) is a popular technical indicator used by traders to assess the strength of a trend. It was developed by J. Welles Wilder Jr. and is often used in combination with other technical analysis tools.
Read Also: Downsides of Gold Futures: Understanding the Disadvantages
The ADX measures the strength of a trend on a scale from 0 to 100. A reading above 25 suggests that a strong trend is present, while a reading below 25 suggests a weak trend or a choppy market.
The ADX is composed of three lines: the ADX line, the +DI line, and the -DI line. The ADX line shows the strength of the trend, while the +DI line and the -DI line show the direction of the trend. The crossing over of the +DI line and the -DI line can indicate potential buy or sell signals.
Traders use the ADX to determine whether to enter a trade, as well as to manage and exit their positions. For example, if the ADX is above 25 and rising, it might be a good time to enter a long position. Conversely, if the ADX is below 25 and falling, it might be a good time to exit a position.
It is important to note that the ADX is a lagging indicator, meaning that it provides information about past price movements. As such, it is often used in combination with other indicators and analysis methods to confirm signals and improve accuracy.
In conclusion, the ADX indicator is a valuable tool for traders to assess the strength of a trend and make informed trading decisions. It can help identify potential trading opportunities and manage risk. However, it should be used in conjunction with other indicators and analysis methods for more reliable results.
The ADX (Average Directional Index) indicator is a technical analysis tool that is used to measure the strength of a trend. It was developed by J. Welles Wilder and is commonly used in the stock market and other financial markets.
The ADX indicator consists of three lines: the ADX line, the +DI line, and the -DI line. The ADX line measures the overall strength of the trend, while the +DI line measures the strength of the bullish trend and the -DI line measures the strength of the bearish trend.
The ADX line typically ranges from 0 to 100, with values above 25 indicating a strong trend and values below 25 indicating a weak trend. A rising ADX line suggests that the trend is getting stronger, while a falling ADX line suggests that the trend is weakening.
Read Also: Does GLD pay dividends? | Everything you need to know about GLD dividend payments
The +DI and -DI lines are used to identify the direction of the trend. If the +DI line is above the -DI line, it indicates a bullish trend, and if the -DI line is above the +DI line, it indicates a bearish trend. Traders often look for crossovers between the +DI and -DI lines to generate trading signals.

The ADX indicator can be used to identify trending markets and to determine the strength of a trend. It is also used in conjunction with other indicators to confirm trading signals. For example, if the ADX line is rising and the +DI line is above the -DI line, it might be a good time to go long. Conversely, if the ADX line is falling and the -DI line is above the +DI line, it might be a good time to go short.
Overall, the ADX indicator provides valuable information about the strength and direction of a trend, helping traders make informed trading decisions. However, it is important to note that the ADX indicator is not a standalone tool but should be used in conjunction with other technical analysis tools for optimal results.
| ADX | +DI | -DI |
|---|---|---|
| Measures the overall strength of the trend | Measures the strength of the bullish trend | Measures the strength of the bearish trend |
| Ranges from 0 to 100 | Identifies a bullish trend | Identifies a bearish trend |
| A rising ADX suggests a stronger trend | +DI above -DI indicates a bullish trend | -DI above +DI indicates a bearish trend |
The Average Directional Index (ADX) is a technical indicator used to measure the strength of a trend in the financial market. It is a popular tool among traders and investors to identify whether a trend is strong or weak and to determine possible entry and exit points for trades.
The ADX indicator is calculated using a formula based on the moving average of price ranges over a specific period of time. The formula involves calculating the direction of each price range and then smoothing out the values to get the final ADX value. The indicator ranges from 0 to 100, with higher values indicating a stronger trend and lower values indicating a weaker trend.
A high ADX value indicates a strong trend in the market. It suggests that the trend is likely to continue, and traders may consider entering or staying in a trade that aligns with the direction of the trend. However, it is important to note that a high ADX value alone does not provide information about the direction of the trend.
The ADX indicator can be used to identify potential entry and exit points for trades. Traders can look for a rising ADX to identify a strengthening trend and consider entering a trade in the direction of the trend. Additionally, a declining ADX could signal a weakening trend and serve as a potential signal to exit a trade or tighten stop-loss levels.
Yes, the ADX indicator has certain limitations. It does not provide information about the direction of the trend, only the strength. Traders need to use other technical analysis tools or price action to determine the direction of the trend. Additionally, the ADX indicator is not effective in range-bound or sideways markets, as it tends to provide false or misleading signals in such conditions.
The ADX (Average Directional Index) indicator is a technical analysis tool used to measure the strength of a price trend. It does not provide information about the direction of the trend, only about its strength.

Is joining IFA free? If you are considering joining the International Finance Association (IFA), you may be wondering whether there is a cost …
Read Article
Understanding the Difference between RFS and RFQ When it comes to procurement processes, two of the most commonly used methods are Request for …
Read Article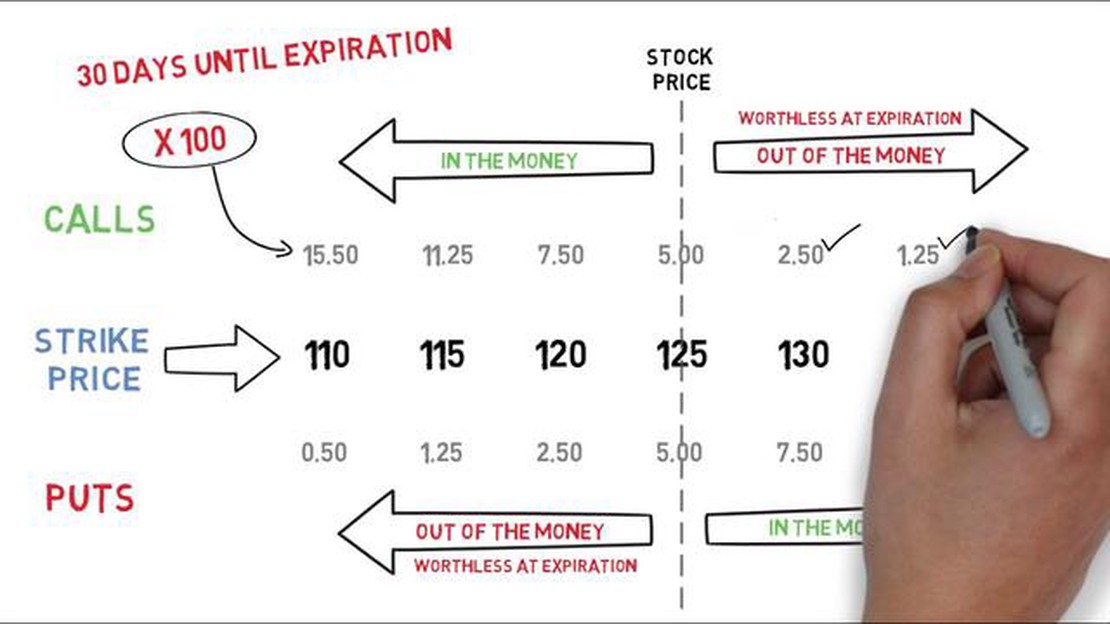
Understanding Orders for Options Trading Options trading is a complex and multifaceted market that requires careful planning and strategic …
Read Article
Understanding the VSA Method in Forex Trading The VSA (Volume Spread Analysis) method is a powerful tool for analyzing the forex market. It is based …
Read Article
Understanding GM Employee Stock Options Employee stock options are a popular form of compensation offered by many companies, and General Motors (GM) …
Read Article
What is the best scalping trend indicator? Discover the Top Scalping Trend Indicators for Maximum Profits Table Of Contents What is Scalping? How …
Read Article


