

Calculating Volume in Option Trading: A Comprehensive Guide
Calculating Volume in Option Trading Understanding and analyzing volume is crucial for successful option trading and can provide valuable insights …
Read Article
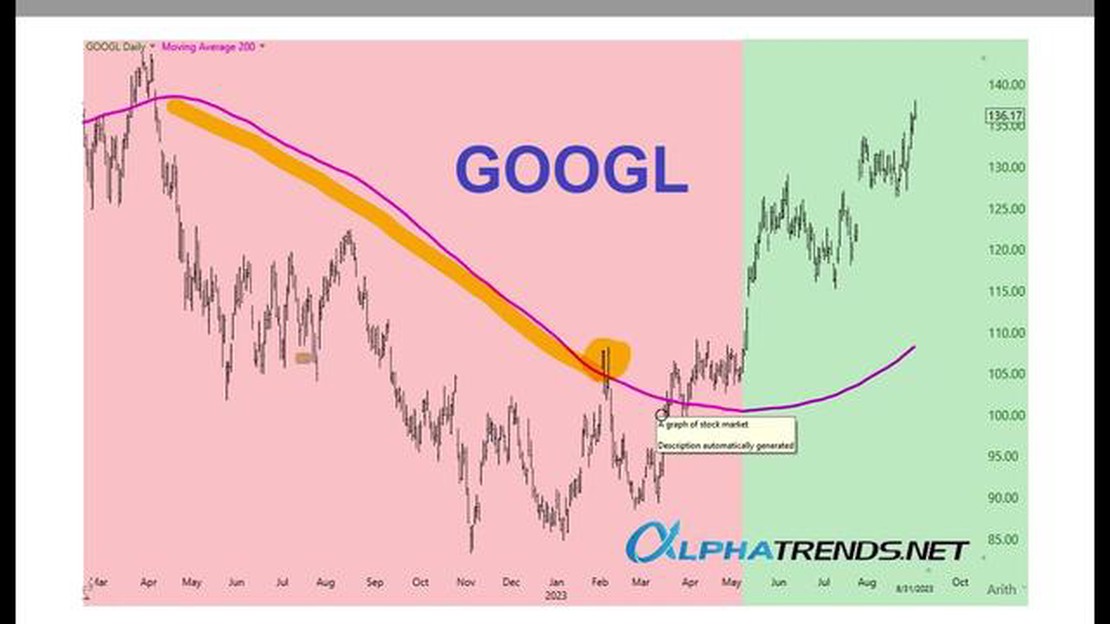
When it comes to analyzing the stock market, one of the most commonly used technical indicators is the moving average. One particular type of moving average that traders and investors pay close attention to is the 200-day moving average for the Dow Jones Industrial Average (DJIA).
The 200-day moving average is a trend-following indicator that smooths out price action by calculating the average closing price of the DJIA over the past 200 trading days. This long-term moving average is considered by many to be a reliable measure of the overall market trend.
Traders and investors look at the 200-day moving average to determine the general direction of the market. If the DJIA is trading above its 200-day moving average, it is often seen as a bullish signal, indicating that the market is in an uptrend. Conversely, if the DJIA is trading below its 200-day moving average, it is viewed as a bearish signal, suggesting that the market is in a downtrend.
Furthermore, the 200-day moving average can also act as a support or resistance level. During an uptrend, the DJIA may find support near its 200-day moving average, with buyers stepping in to prevent prices from falling further. On the other hand, during a downtrend, the DJIA may encounter resistance near its 200-day moving average, with sellers preventing prices from rising significantly.
It is important to note that the 200-day moving average is not a foolproof indicator and should not be used in isolation. It should be used in conjunction with other technical and fundamental analysis tools to make well-informed investment decisions. Nonetheless, understanding the 200-day moving average can provide valuable insights into the overall market trend and help traders and investors navigate the stock market more effectively.
The 200-day moving average is a technical indicator used in financial markets to analyze the overall trend of an asset’s price over a period of time. It is calculated by taking the average closing price of an asset for the past 200 trading days, and then plotting this average on a chart.
The 200-day moving average is commonly used by traders and investors to identify long-term trends. It helps to smooth out short-term fluctuations in price and provide a clearer picture of the asset’s overall direction. By comparing the current price to its 200-day moving average, traders can determine whether the asset is trading above or below its long-term trend.

When the price is above the 200-day moving average, it is often seen as a bullish signal, indicating that the asset is in an uptrend. Conversely, when the price is below the 200-day moving average, it is considered a bearish signal, suggesting that the asset is in a downtrend.
The 200-day moving average is also used as a support or resistance level. If the price approaches the 200-day moving average and bounces off it, it may indicate a strong support level. On the other hand, if the price breaks through the 200-day moving average, it could suggest a weakening trend or a reversal in the asset’s direction.
It’s important to note that the 200-day moving average is just one tool among many used by traders and investors. It should be used in conjunction with other technical indicators and analysis methods to make informed trading decisions.
Read Also: Interactive Brokers API: Everything You Need to Know
The 200-day moving average is a popular technical indicator used by traders and investors to assess the overall trend of a particular stock or market index, such as the Dow Jones Industrial Average (DJIA). It is calculated by averaging the closing prices of the stock or index over the past 200 trading days.
The 200-day moving average is commonly used to determine the long-term trend of an asset. By smoothing out short-term price fluctuations, it provides a clearer picture of the overall direction of the market. The concept behind the moving average is that it helps to filter out the noise and highlights the underlying trend.
Traders and investors use the 200-day moving average to identify potential buy or sell signals. When the price of an asset is trading above its 200-day moving average, it is often considered to be in an uptrend, indicating a potential buying opportunity. Conversely, when the price is below its 200-day moving average, it is seen as a downtrend, suggesting a potential selling opportunity.
Furthermore, crossovers between the price and the 200-day moving average can also be significant. When the price crosses above the moving average, it is known as a “golden cross” and is considered a bullish signal. On the other hand, when the price crosses below the moving average, it is called a “death cross” and is seen as a bearish signal.
Read Also: Best Time Frame for Trendline Analysis: Finding the Perfect Fit
It is important to note that the 200-day moving average is just one tool in a trader’s toolbox and should not be used in isolation. It is recommended to use it in conjunction with other indicators and technical analysis techniques to make informed investment decisions.
In conclusion, the 200-day moving average is a valuable tool for traders and investors. It provides a smoothed-out view of the long-term trend, helping to identify buying and selling opportunities. By understanding the basics of the 200-day moving average, traders can enhance their decision-making process and improve their overall trading strategy.
The 200-day moving average is a popular technical indicator that is used to analyze the long-term trend of a stock or index. It is calculated by taking the average closing price of the stock or index over the past 200 trading days.

The 200-day moving average is often used as a signal for traders to determine the overall direction of a stock or index. When the price of a stock or index is above its 200-day moving average, it is considered to be in an uptrend, and when the price is below the moving average, it is considered to be in a downtrend.
The 200-day moving average is important because it provides a simple and objective way to analyze the long-term trend of a stock or index. By comparing the current price to the 200-day moving average, traders can get a sense of whether the stock or index is in an uptrend or downtrend.
While the 200-day moving average is primarily used to analyze the long-term trend of a stock or index, it can also be used by short-term traders to identify potential reversals or entry points. However, it is important to use additional indicators or analysis techniques to confirm the signals provided by the 200-day moving average.
The reliability of the 200-day moving average depends on various factors, including the volatility and liquidity of the stock or index being analyzed. In general, the 200-day moving average is considered to be a reliable indicator for determining the long-term trend, but it should always be used in conjunction with other analysis tools and indicators.
The 200-day moving average is a technical indicator used to analyze the overall trend of a stock or index. It calculates the average price of the stock or index over the past 200 trading days and plots it on a chart. This moving average is used to identify potential support and resistance levels and help traders make decisions on when to buy or sell.
The 200-day moving average is calculated by adding up the closing prices of a stock or index over the past 200 trading days and then dividing the sum by 200. This gives the average price over the specified period. The calculation is done daily to create a continuous moving average line on a chart.

Calculating Volume in Option Trading Understanding and analyzing volume is crucial for successful option trading and can provide valuable insights …
Read Article
Trading Options on CFDs: Everything You Need to Know Welcome to our comprehensive guide on trading options on CFDs – Contract for Difference. CFDs are …
Read Article
Understanding the 99% VaR: Explained In the world of finance and investment, risk is an ever-present factor that cannot be ignored. One of the most …
Read Article
Can cyclones be predicted? Cyclones are one of the most powerful and destructive natural disasters on our planet. These violent storms, also known as …
Read Article
Understanding Incentive Stock Options Incentive Stock Options (ISOs) are a type of stock option that companies grant to their employees as a form of …
Read Article
Are there any legal binary options? Binary options have gained popularity in recent years as an investment option for traders. These options offer a …
Read Article


