

What Happens if Nobody Buys My Option? | Understanding the Consequences
What Happens If No One Buys My Option? Options trading can be an exciting and potentially profitable endeavor, but it’s important to understand the …
Read Article
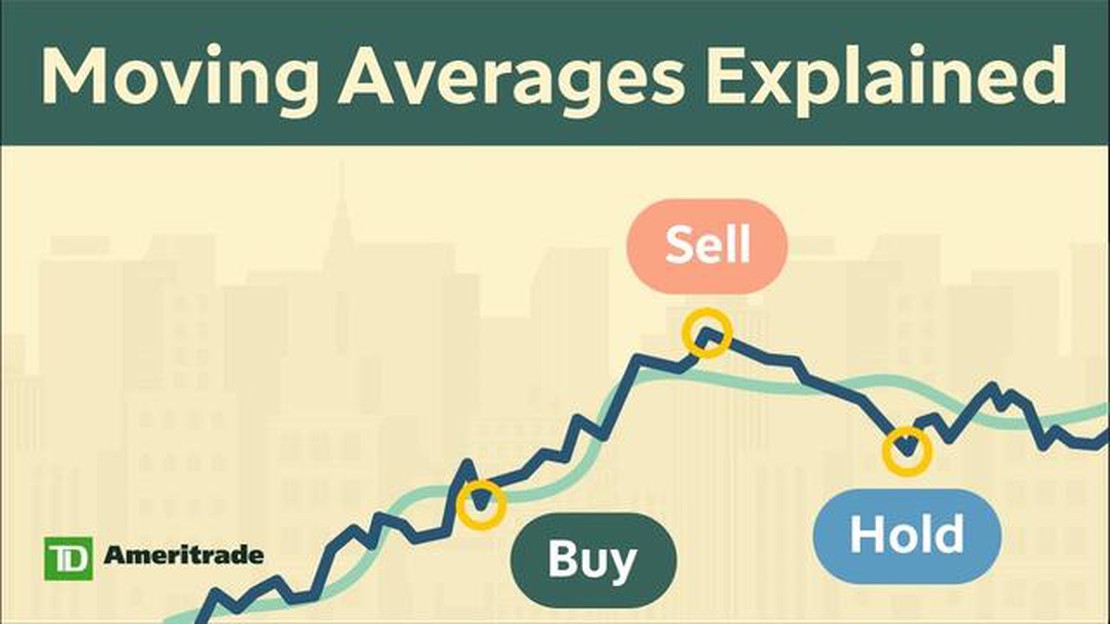
The 200-day Exponential Moving Average (EMA) is a commonly used technical indicator in financial markets. It is a type of moving average that places more weight on recent price data, making it more responsive to short-term price changes compared to traditional moving averages. Traders and investors often use the 200-day EMA to identify trends and potential entry or exit points in the market.
The 200-day EMA is calculated by taking the average of the closing prices over the past 200 days, with more recent prices given greater weight. This means that the EMA will react more quickly to changes in price compared to a simple moving average (SMA), which gives equal weight to all prices within the time period.
When the price of an asset is above the 200-day EMA, it is generally considered to be in an uptrend, indicating that the overall trend is bullish. Conversely, when the price is below the 200-day EMA, it is typically seen as a sign of a downtrend, suggesting that the overall trend is bearish.
Traders may use the 200-day EMA in conjunction with other technical indicators to confirm signals and make more informed trading decisions. For example, a crossover between the 200-day EMA and a shorter-term moving average, such as the 50-day EMA, can be seen as a bullish or bearish signal, depending on the direction of the crossover.
It’s important to note that the 200-day EMA is just one tool among many used by traders and investors. It should not be used in isolation, but rather as part of a comprehensive trading strategy that takes into account other factors such as market trends, risk tolerance, and fundamental analysis.
The 200-day exponential moving average (EMA) is a technical indicator used in stock trading and investing. It is a trend-following indicator that calculates the average price of a security over the past 200 trading days, giving more weight to recent price data.
The EMA is different from a simple moving average (SMA) because it gives more significance to recent data points, while the SMA gives equal weight to all data points. The EMA is calculated using a formula that takes into account the previous EMA value and the current closing price.
The 200-day EMA is often used by traders and investors to identify long-term trends. It is considered a key level of support or resistance, depending on whether the price is above or below the EMA. If the price is above the 200-day EMA, it is considered bullish, indicating a possible uptrend. Conversely, if the price is below the 200-day EMA, it is considered bearish, indicating a possible downtrend.
Traders and investors may also use the 200-day EMA as a signal to buy or sell. For example, if the price crosses above the 200-day EMA, it may be seen as a buy signal. Conversely, if the price crosses below the 200-day EMA, it may be seen as a sell signal.

It is important to note that the 200-day EMA should not be used in isolation but should be used in conjunction with other technical indicators and analysis techniques to make informed trading decisions.
The 200-day Exponential Moving Average (EMA) is a technical indicator widely used by traders and investors to analyze long-term trends in the financial markets. It calculates the average price of a security over a 200-day period and places more weight on recent prices, making it more responsive to current market conditions compared to a simple moving average.
The calculation of the 200-day EMA involves using a multiplier that places more importance on recent price data. This multiplier exponentially decreases as each day passes, with newer prices having more influence on the average compared to older prices. This allows the 200-day EMA to quickly respond to changes in price trends.
Traders often use the 200-day EMA as a signal for determining the overall trend of a security. When the price of a security is trading above the 200-day EMA, it is considered to be in an uptrend, indicating that buyers are in control of the market. Conversely, if the price is trading below the 200-day EMA, it is seen as a downtrend, indicating that sellers are dominant.
Read Also: Discover the Most Effective Breakout Strategy for Maximum Profits
The 200-day EMA can also be used to identify potential support and resistance levels. When the price of a security approaches the 200-day EMA, it may act as a support level, preventing the price from falling further. On the other hand, when the price is far above the 200-day EMA, it can act as a resistance level, making it difficult for the price to continue rising.
Additionally, traders often look for crossovers between the 200-day EMA and shorter-term moving averages, such as the 50-day EMA. When the 50-day EMA crosses above the 200-day EMA, it is seen as a bullish signal, indicating that the bullish momentum is increasing. Conversely, when the 50-day EMA crosses below the 200-day EMA, it is considered a bearish signal, suggesting that the bearish momentum is strengthening.
Overall, the 200-day EMA is a versatile technical indicator that can provide valuable insights into the long-term trends and potential support/resistance levels of a security. Traders and investors often incorporate it into their analysis to make informed decisions about buying or selling securities.
The 200-Day Exponential Moving Average (EMA) is a popular tool used in technical analysis by traders and investors. It is widely considered to be a significant indicator for determining the overall trend and potential future direction of a security or financial instrument.
Read Also: Understanding the Bloomberg GSAM FX Carry Index: A Comprehensive Guide
The 200-Day EMA is calculated by taking the average price of a security over the past 200 trading days, giving greater weight to more recent prices. This moving average is believed to provide a smoother and more accurate representation of the long-term trend compared to other moving averages. Traders often use the 200-Day EMA as a reference point for determining if a security is in a bullish (upward) or bearish (downward) trend.
One of the key reasons for the importance of the 200-Day EMA is its ability to filter out short-term market noise and provide a clearer picture of the long-term trend. By using a longer time frame, it helps to smooth out fluctuations caused by daily or weekly price movements, allowing traders to focus on the overall direction of the market.
Furthermore, the 200-Day EMA is seen as a significant level of support or resistance. When a security’s price is above the 200-Day EMA, it is often considered to be in a bullish trend, signaling potential buying opportunities. Conversely, when the price falls below the 200-Day EMA, it is seen as a bearish signal, indicating potential selling opportunities.
Additionally, the 200-Day EMA is widely followed by institutional investors and large market participants, which can contribute to its significance and influence on price action. When these market players observe the price approaching or crossing the 200-Day EMA, it can trigger significant buying or selling activity, leading to a potential acceleration of the trend.

Overall, the 200-Day EMA plays a crucial role in technical analysis due to its ability to provide a reliable indication of the long-term trend and act as a level of support or resistance. Traders and investors often incorporate this moving average into their strategies to help make informed decisions and identify potential trading opportunities.
A moving average is a calculation used to analyze data points by creating a series of averages over a specified period of time.
The 200-day EMA calculates the average price of a security by giving more weight to recent data points and less weight to older data points. It is calculated by taking the current price, multiplying it by a constant, and adding it to the previous day’s EMA multiplied by 1 minus the constant.
The 200-day EMA is commonly used because it provides a long-term trend analysis of a security’s price. It helps traders and investors identify potential buying or selling opportunities based on the direction of the trend.
When the 200-day EMA crosses over the price of a security from below, it is considered a bullish signal, indicating a potential upward trend. Conversely, when the 200-day EMA crosses under the price, it is considered a bearish signal, indicating a potential downward trend.
One limitation of using the 200-day EMA is that it may lag behind sudden price movements or market changes. It is also important to consider other technical indicators and fundamental analysis when making trading or investing decisions.
The 200-day Exponential Moving Average (EMA) is a technical indicator used in financial analysis to smooth out price data and identify trends over a longer time period. It calculates the average price over the past 200 trading days, giving more weight to recent price data.
The 200-day EMA is considered a significant indicator because it provides a long-term perspective on market trends. It is widely used by traders and investors to determine the overall direction of a market or a particular asset. When the price is above the 200-day EMA, it is often considered a bullish signal, while a price below the 200-day EMA is considered bearish.

What Happens If No One Buys My Option? Options trading can be an exciting and potentially profitable endeavor, but it’s important to understand the …
Read Article
How to create a stock options watchlist Building a stock options watchlist is an essential step for any investor looking to navigate the complex world …
Read Article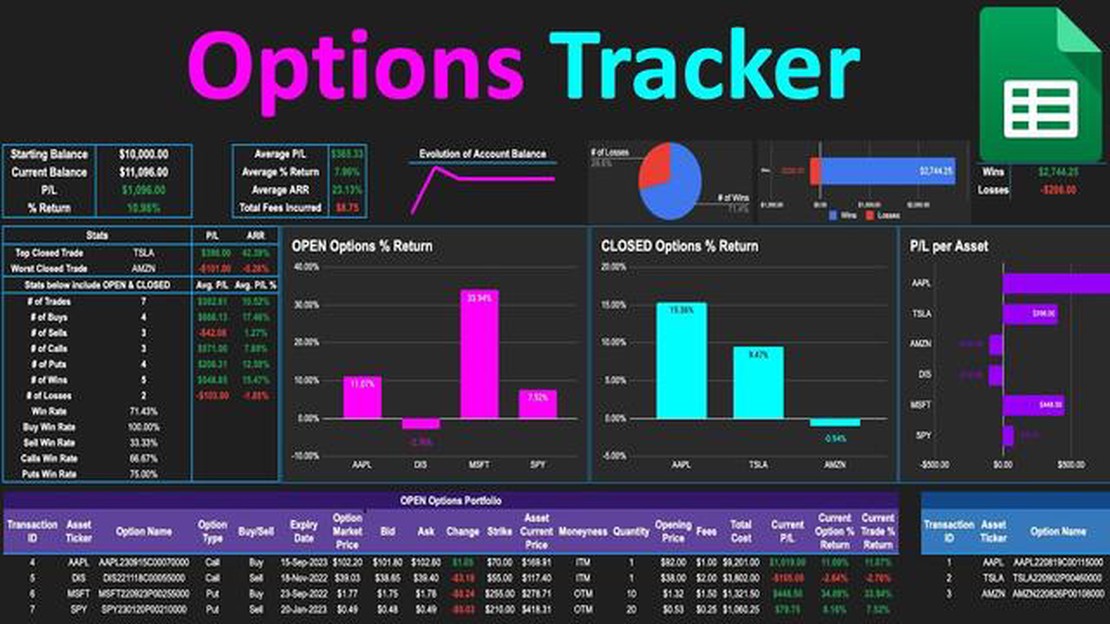
How to Use Google Sheets to Track Options Prices Are you looking for an easy way to track options prices? Look no further! Google Sheets can be a …
Read Article
What is the lot size of natural gas in option trading? When it comes to option trading, understanding the lot size of natural gas is essential. The …
Read Article
How to withdraw money from IronFX: Step-by-step guide Withdrawing money from your IronFX account is a straightforward process that can be completed in …
Read Article
Learn the 3 Essential Chords to Play Any Song Have you ever dreamed of playing your favorite songs on the guitar but feel intimidated by all those …
Read Article


