


Is FX considered an Over-the-Counter (OTC) Option? Explained
Is FX an OTC Option? Foreign exchange, often referred to as Forex or FX, is the largest and most liquid financial market in the world. Unlike other …
Read Article
Bollinger Bands are a popular technical analysis tool used by traders to analyze price volatility and identify potential entry and exit points in the market. Developed by John Bollinger in the 1980s, Bollinger Bands consist of a simple moving average (SMA) as well as an upper band and a lower band that are calculated based on the standard deviation of the price.
The Bollinger Bands can provide traders with valuable information about the market’s volatility and the likelihood of a trend reversal or continuation. One of the most commonly used strategies with Bollinger Bands is the crossover strategy, which involves analyzing the movements of the price in relation to the upper and lower bands.
In this comprehensive guide, we will explore the concept of Bollinger Bands crossover in detail, including how to interpret the signals provided by this strategy and how to effectively implement it in your trading. Whether you are a beginner or an experienced trader, understanding Bollinger Bands crossover can be a valuable tool in your trading arsenal.
Throughout this guide, we will cover various topics related to Bollinger Bands crossover, such as the different types of crossovers, the significance of these crossovers, and the potential risks and limitations associated with this strategy. By the end of this guide, you will have a solid understanding of Bollinger Bands crossover and be able to incorporate it into your trading strategy with confidence.
Disclaimer: Trading involves risk and may not be suitable for everyone. This guide is for informational purposes only and should not be considered as financial advice. Always do your own research and consult with a qualified financial professional before making any investment decisions.
Bollinger Bands are a popular technical analysis tool that was developed by John Bollinger in the early 1980s. They are used to measure the volatility of a financial instrument, such as stocks, commodities, or currencies. Bollinger Bands consist of three lines plotted on a price chart: the middle band, the upper band, and the lower band.
The middle band is a simple moving average, typically based on the closing price of the period being analyzed. The upper band is calculated by adding a specified number of standard deviations to the middle band, while the lower band is calculated by subtracting the same number of standard deviations from the middle band. The standard deviation is a measure of volatility and is used to determine the width of the bands.
Bollinger Bands provide a visual representation of price volatility. When the price is more volatile, the bands widen, and when the price is less volatile, the bands contract. Traders use this information to identify potential trading opportunities.

One popular trading strategy involving Bollinger Bands is the Bollinger Bands crossover. This occurs when the price crosses above or below the upper or lower band, indicating a potential reversal or continuation of the trend. Traders will often look for confirmation from other technical indicators or chart patterns before making a trade.
Read Also: Discover the Ideal Trading Time for EUR JPY: Boost Your Forex Trading Success
| Advantages of using Bollinger Bands | Disadvantages of using Bollinger Bands |
|---|---|
| * Easy to understand and use |
In conclusion, Bollinger Bands are a powerful tool for technical analysis that can help traders identify potential trading opportunities based on price volatility. However, they should be used in conjunction with other indicators and analysis techniques to increase the probability of making successful trades.
One of the key ways to use Bollinger Bands is to generate crossover signals. Crossovers occur when the price of an asset moves from one band to another. These signals can provide traders with potential entry and exit points for their trades.
Here are some steps to use Bollinger Bands for crossover signals:
1. Identify the trend: Before using Bollinger Bands for crossover signals, it is important to identify the overall trend of the market. Bollinger Bands work best in trending markets, so it is essential to determine if the market is moving up, down, or sideways.
2. Set the parameters: Bollinger Bands consist of three lines – the upper band, the lower band, and the middle band. The middle band is typically a simple moving average, while the upper and lower bands are calculated by adding and subtracting a certain number of standard deviations from the middle band. Traders can adjust the parameters of the Bollinger Bands to suit their trading style and timeframe.
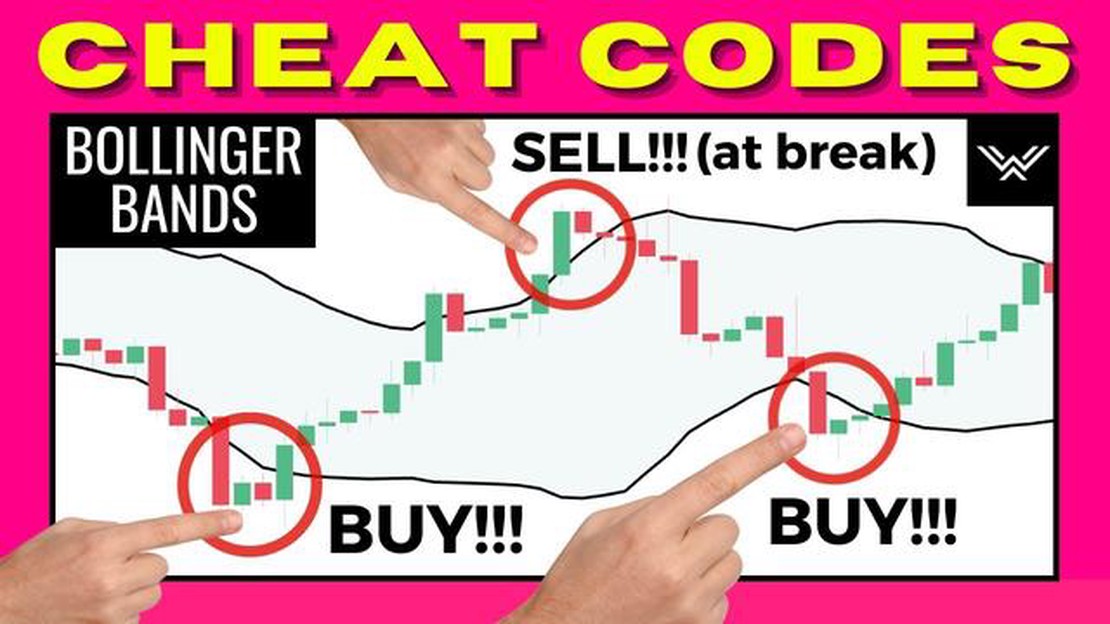
3. Wait for a crossover: Once the Bollinger Bands are set up, you can wait for a crossover signal. A crossover signal occurs when the price of an asset moves from one band to another. For example, if the price moves from below the lower band to above the middle band, it is a bullish crossover signal. Conversely, if the price moves from above the upper band to below the middle band, it is a bearish crossover signal.
4. Confirm the signal: While crossovers can be useful, it is important to confirm the signal with other technical indicators or price action patterns. For example, traders can use momentum indicators like the Relative Strength Index (RSI) or the Moving Average Convergence Divergence (MACD) to confirm the validity of the crossover signal.
Read Also: When did BHP list on LSE? - Timeline and key milestones
5. Trade the crossover: Once the crossover signal is confirmed, traders can enter a trade in the direction of the crossover. For example, if there is a bullish crossover signal, traders can consider buying the asset. Conversely, if there is a bearish crossover signal, traders can consider selling or shorting the asset.

6. Manage the trade: After entering a trade, it is important to manage the trade properly. Traders should set stop-loss orders to limit potential losses and take-profit orders to secure profits. It is also important to regularly monitor the trade and adjust the stop-loss and take-profit levels as the price continues to move.
Conclusion: Bollinger Bands can be a powerful tool for generating crossover signals. By identifying trends, setting up the Bollinger Bands, waiting for crossovers, confirming the signals, and properly managing the trades, traders can potentially take advantage of these signals to improve their trading performance.
Bollinger Bands are a technical analysis tool that consists of a simple moving average and two standard deviation lines. They are used to measure volatility and identify overbought or oversold conditions in the market.
Bollinger Bands are calculated by using a simple moving average as the center line and two standard deviation lines above and below the moving average. The standard deviation determines the width of the bands, which expands and contracts based on market volatility.
Bollinger Bands crossover occurs when the price of an asset moves from one side of the Bollinger Bands to the other. It is a signal that indicates a potential change in the direction of the trend and can be used to identify buying or selling opportunities.
Bollinger Bands crossover can be used in trading as a confirmation signal for buy or sell trades. When the price crosses above the upper band, it may indicate an overbought condition and a potential sell signal. Conversely, when the price crosses below the lower band, it may indicate an oversold condition and a potential buy signal.
Yes, there are limitations and risks associated with using Bollinger Bands crossover. It is important to note that Bollinger Bands are not a standalone trading strategy and should be used in conjunction with other technical indicators and analysis tools. Additionally, false signals and whipsaws can occur, especially in volatile or trending markets, so it is important to use proper risk management and stop-loss orders.

Is FX an OTC Option? Foreign exchange, often referred to as Forex or FX, is the largest and most liquid financial market in the world. Unlike other …
Read Article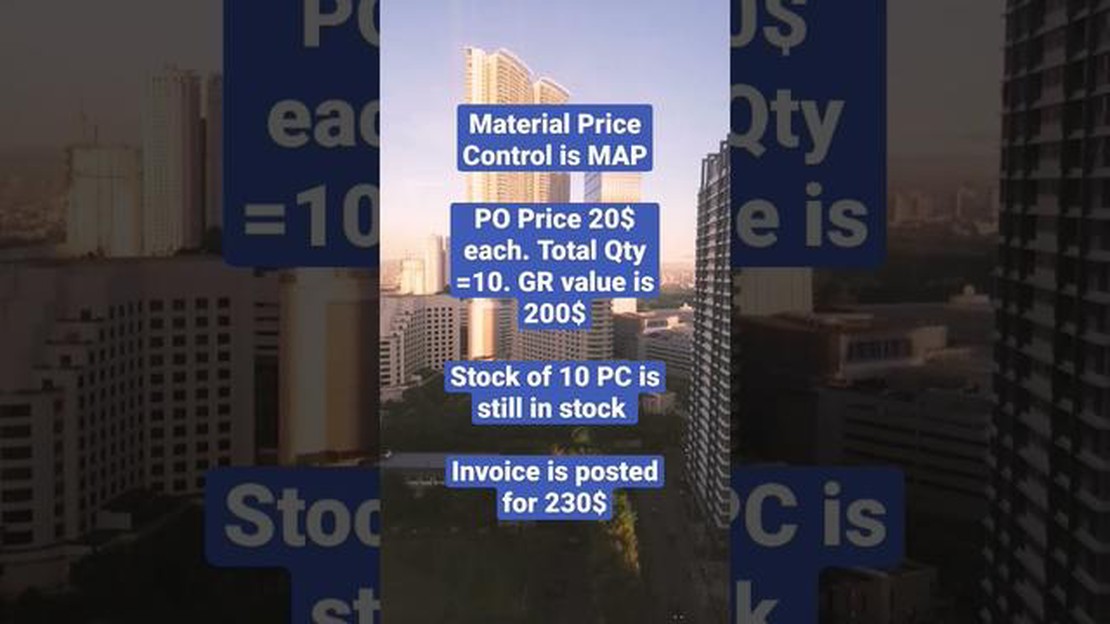
Advantages of moving average price in SAP When it comes to managing inventory and tracking costs, businesses choose SAP for its comprehensive …
Read Article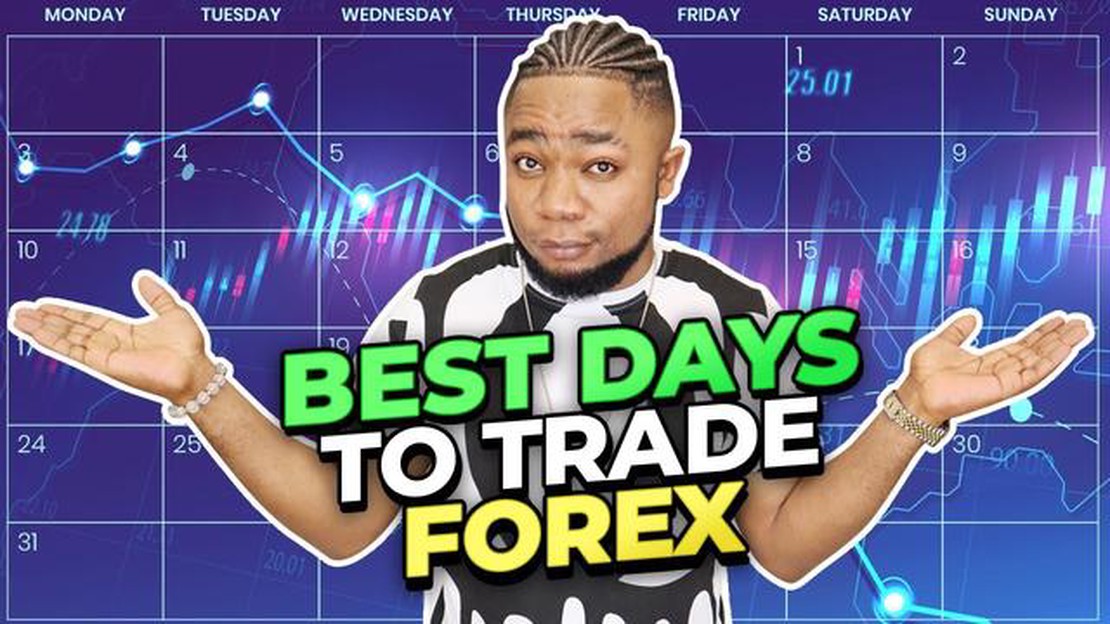
Is Forex Trading Available 7 Days a Week? Forex trading, also known as foreign exchange trading, is a global decentralized market where the world’s …
Read Article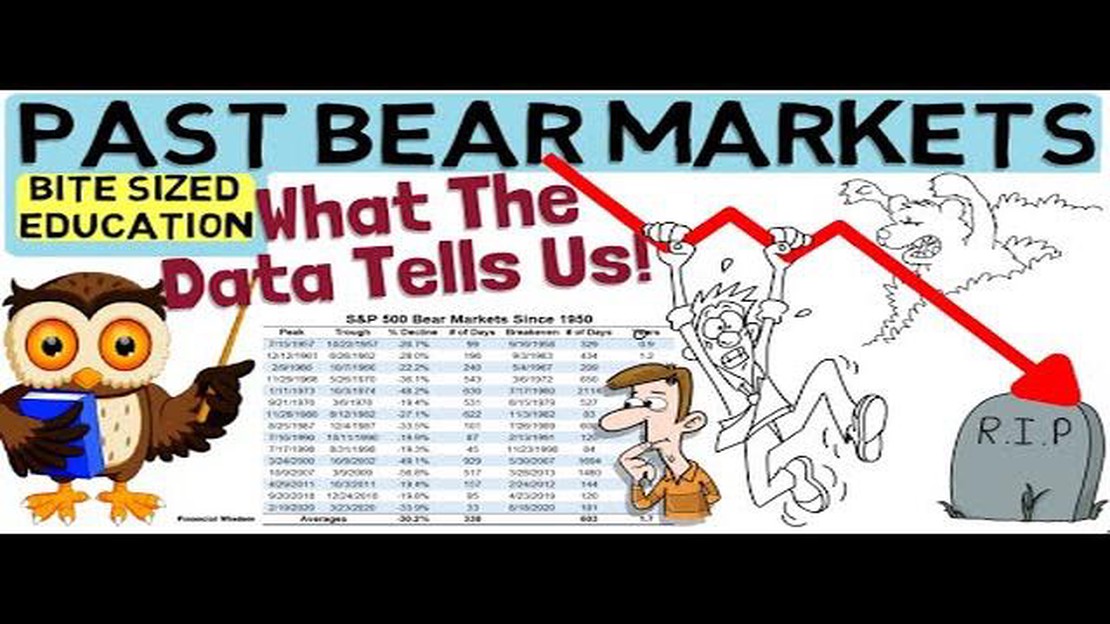
Trading in a bear market: Challenges and Opportunities In the world of finance, a bear market is characterized by declining prices and a pessimistic …
Read Article
Download and Install WiFi Drivers for Windows 10 Is your WiFi connection on your Windows 10 computer not working properly? One possible solution to …
Read Article
What is forex l? Forex is short for Foreign Exchange, and it refers to the global market where currencies are bought and sold. Forex trading is the …
Read Article


