
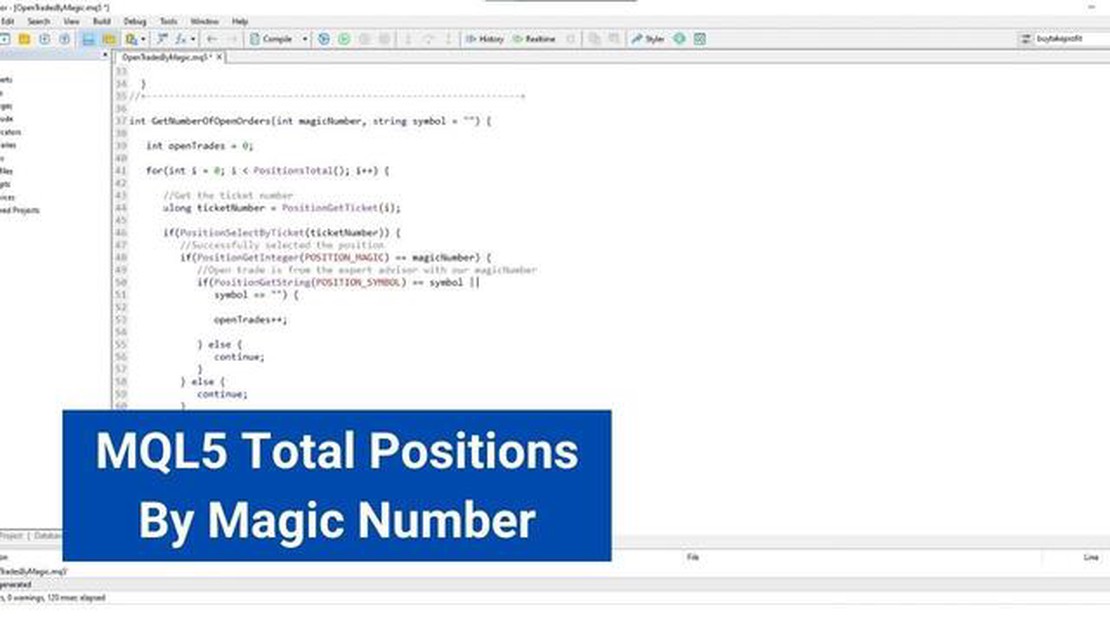

Discover the Magic Number in Expert Advisor Trading
Unlocking the Secret: Discovering the Magic Number in Expert Advisor Trading Expert Advisors, also known as EAs, are automated trading systems that …
Read Article
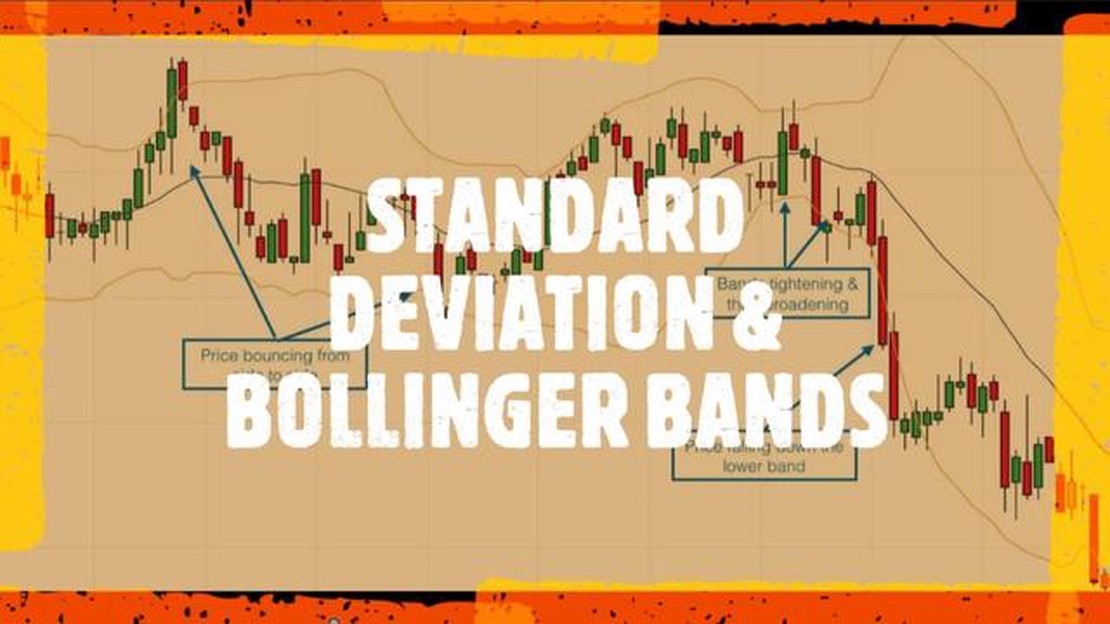
Bollinger Bands are a popular technical analysis tool used to measure price volatility. They consist of a simple moving average (SMA) line in the center and two standard deviation (SD) lines above and below the SMA line. The SD lines create a channel that represents the range of price volatility.
But are Bollinger Bands really a measure of standard deviation? Despite their name, Bollinger Bands are not directly based on standard deviation. Rather, they are based on the concept of volatility and use standard deviation as a key component to calculate the upper and lower bands.
When market volatility increases, the range between the upper and lower bands widens, indicating greater price fluctuations. Conversely, when volatility decreases, the range between the bands narrows, indicating less price movement. This dynamic nature allows traders and analysts to assess the market conditions and make informed decisions.
While Bollinger Bands can be used on their own to identify potential trend reversals and overbought/oversold conditions, they are often used in conjunction with other technical indicators and chart patterns to confirm signals and improve accuracy.
Understanding the relationship between Bollinger Bands and standard deviation is essential in effectively using this powerful technical analysis tool. By interpreting the positioning of the price within the bands and monitoring the width of the bands, traders can gain valuable insights into market volatility and potential price reversals.
Bollinger Bands is a technical analysis tool that was developed by John Bollinger in the early 1980s. It is used to measure the volatility and identify potential overbought or oversold conditions in the financial markets.

The Bollinger Bands consist of three lines: the upper band, the lower band, and the middle band. The middle band is a simple moving average, usually calculated using a 20-day period. The upper and lower bands are typically set two standard deviations above and below the middle band, respectively.
The width of the Bollinger Bands is determined by the volatility of the price. When the volatility increases, the bands widen, and when the volatility decreases, the bands narrow. Traders and investors can use this information to identify periods of low volatility, which may indicate a potential price breakout, and periods of high volatility, which may signal an imminent reversal or consolidation.
In addition to measuring volatility, Bollinger Bands can also be used to generate buy or sell signals. When the price touches the upper band, it may be considered overbought, and a sell signal could be generated. Conversely, when the price touches the lower band, it may be considered oversold, and a buy signal could be generated. Traders often look for confirmation from other technical indicators or price patterns before taking action.
Bollinger Bands can be applied to any financial instrument, such as stocks, commodities, or currencies, and can be used on various timeframes, from short-term intraday charts to long-term weekly or monthly charts.
Read Also: Beginner's guide: How to play Nifty options
Advantages and Disadvantages of Bollinger Bands
| Advantages | Disadvantages | | - Provides a visual representation of volatility | - Not a standalone indicator, should be used in conjunction with other tools | | - Can help identify potential price breakouts or reversals | - Can produce false signals during periods of low volatility | | - Can be customized to suit individual trading preferences | - May lag behind significant market moves |
The concept of standard deviation is a measure of the dispersion or variability of a set of data points. It quantifies the degree to which individual data points vary from the mean or average of the dataset.
Standard deviation is calculated by taking the square root of the variance, which is the average of the squared differences between each data point and the mean. This measurement provides a single value that represents the spread of data around the mean.
A high standard deviation indicates that the data points are spread out over a larger range, whereas a low standard deviation indicates that the data points are clustered closely around the mean. This information is valuable in assessing the reliability and consistency of a dataset.
Bollinger Bands, which are frequently used in financial analysis, utilize standard deviation as a key component of their calculation. By incorporating standard deviation into the construction of the bands, Bollinger Bands provide a visual representation of price volatility and potential trading opportunities.
Read Also: Why Do Options Prices Change Overnight? | Understanding the Factors Behind Overnight Options Price Movements
Understanding standard deviation is essential in comprehending Bollinger Bands and their significance as a measure of price volatility. By analyzing the standard deviation component of Bollinger Bands, traders and investors can make informed decisions about potential entry and exit points in the market.
Bollinger Bands are calculated using a simple moving average (SMA) and a measures of standard deviation. The calculation involves the following steps:
The resulting Bollinger Bands consist of an upper band, a lower band, and a middle band (which is the SMA). The bands expand and contract based on the volatility of the price. When the price is more volatile, the bands widen, and when the price is less volatile, the bands narrow.
Bollinger Bands provide valuable information about the price and volatility of a security. Traders use the bands as an indicator of potential price reversals or breakouts. When the price is near the upper band, it may indicate that the security is overbought, while prices near the lower band may suggest that the security is oversold. Additionally, when the price breaks through the upper or lower band, it may indicate the start of a new trend.

Overall, understanding how Bollinger Bands are calculated and how to interpret them can be a useful tool for traders in analyzing price movements and making informed trading decisions.
Bollinger Bands are a technical analysis tool that measures the volatility of a stock or other security. They consist of a middle band, which is a simple moving average, and two outer bands that are standard deviations above and below the middle band.
Bollinger Bands use standard deviation to determine the width of the bands. The standard deviation is a measure of how much the data deviates from the average. By using a multiple of the standard deviation, the bands expand or contract to reflect the level of volatility in the price of the security being analyzed.
The width of the Bollinger Bands is an indicator of the volatility of the security. When the bands are narrow, it indicates low volatility, while wide bands suggest high volatility. Traders and investors can use this information to make decisions about when to buy or sell a security.
Yes, Bollinger Bands can be used to identify overbought or oversold conditions in the market. When the price of a security reaches or exceeds the upper band, it is considered overbought, and when the price drops to or below the lower band, it is considered oversold. Traders can use this information to anticipate potential reversals in the market.

Unlocking the Secret: Discovering the Magic Number in Expert Advisor Trading Expert Advisors, also known as EAs, are automated trading systems that …
Read Article
Discover How to Obtain Free Forex Trading Opportunities Forex trading has become increasingly popular in recent years, with more and more people …
Read Article
Is Trading 212 profitable? Trading 212 is a popular online trading platform that provides individuals with access to a wide range of financial …
Read Article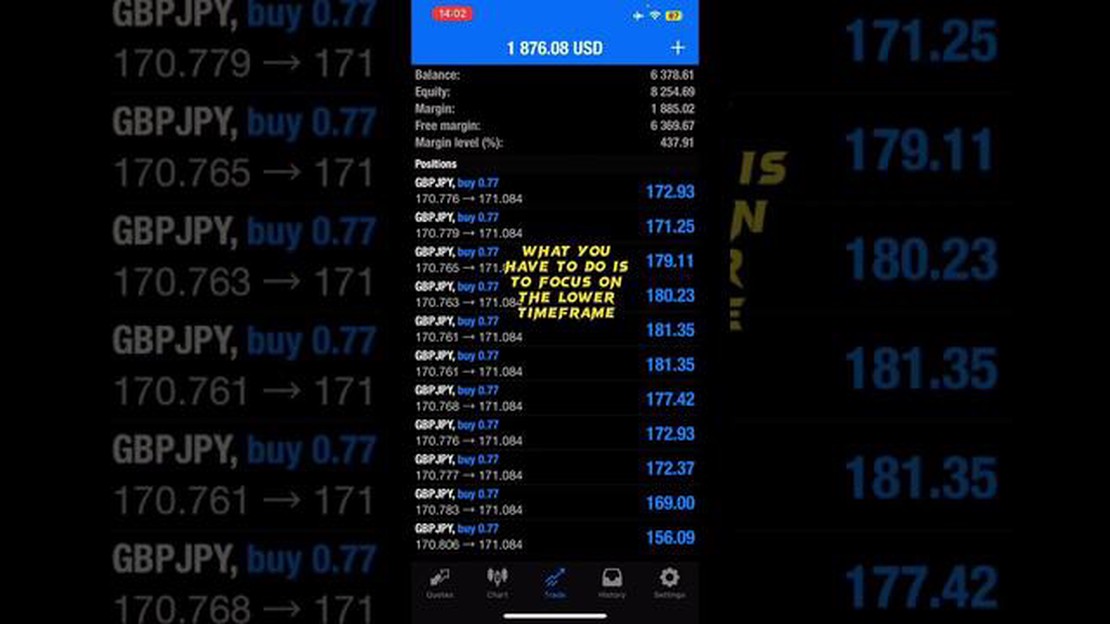
Exploring MLM Forex Opportunities Are you tired of the traditional methods of trading forex? Do you want a new and innovative approach to maximize …
Read Article
Understanding Option Call and Put In the world of finance, options are financial derivatives that give traders the right, but not the obligation, to …
Read Article
The Concept of a Trading Post Empire Trading post empires played a significant role in shaping the history of global trade and exploration. These …
Read Article


