


What You Need to Know: Forex Stop Loss Hunting
Exploring Stop Loss Hunting in Forex Market Forex stop loss hunting is a practice that many traders are familiar with. It refers to a situation where …
Read Article
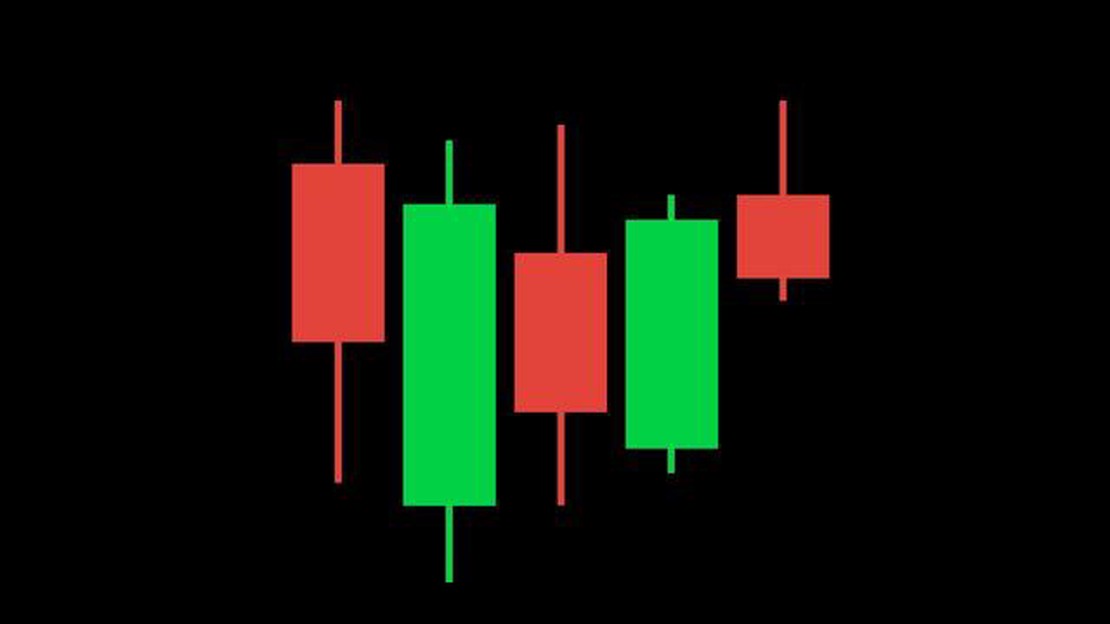
The concept of bearish Japanese candlesticks is an essential tool in technical analysis for traders. These candlesticks provide valuable insights into the market, allowing traders to make informed decisions and develop effective strategies. By understanding bearish candlestick patterns, traders can identify potential price reversals and capitalize on market trends.
Bearish Japanese candlesticks are characterized by a long upper shadow and a short lower body, indicating strong selling pressure in the market. These candlesticks suggest that sellers have taken control of the market, leading to a potential downward movement in price. Traders who recognize these patterns can anticipate a bearish trend and adjust their trading strategies accordingly.
There are various types of bearish Japanese candlestick patterns, such as the bearish engulfing pattern, evening star pattern, and shooting star pattern. Each pattern has its own unique characteristics and indicates different levels of bearishness in the market. By analyzing these patterns, traders can gain insights into the market sentiment and make smarter trading decisions.
In conclusion, understanding bearish Japanese candlesticks is a crucial aspect of trading. As traders recognize and interpret these patterns, they can unlock valuable information about market dynamics and anticipate future price movements. By incorporating this knowledge into their strategies, traders can improve their trading performance and increase their chances of success in the financial markets.
Bearish Japanese candlesticks are a type of technical analysis tool that traders use to predict the future direction of a market. They provide valuable information about the market sentiment and can help traders make informed decisions about their trading strategies.
A bearish candlestick is formed when the closing price of an asset is lower than its opening price. It is represented by a rectangular body and a straight line, known as the wick or shadow, on the top. The shadow represents the highest price reached during the trading period, while the body represents the opening and closing prices.
When bearish candlesticks occur in a chart, they indicate that sellers have taken control of the market and that the price is likely to decrease further. Traders often interpret them as a sign of a potential downtrend or a reversal of an existing uptrend.

The impact of bearish Japanese candlesticks on trading can be significant. They provide traders with important information about market sentiment, allowing them to adjust their strategies accordingly. Traders may decide to sell their assets or open short positions when they see bearish candlestick patterns, expecting that the price will continue to decline.
However, it is essential for traders to consider other factors and indicators when making trading decisions. Bearish candlesticks should not be used in isolation but should be combined with other technical analysis tools and market trends to confirm their signals.
| Advantages of using bearish candlesticks in trading: | Disadvantages of using bearish candlesticks in trading: |
|---|---|
| - Provides insights into market sentiment | - False signals can occur |
| - Helps identify potential downtrends | - May not always accurately predict market movements |
| - Assists in timing entry and exit points | - Should be used in conjunction with other indicators |
In conclusion, bearish Japanese candlesticks are a valuable tool in trading as they provide insights into market sentiment and help traders make more informed decisions. However, they should be used in conjunction with other indicators and factors to ensure accurate predictions and reduce the risk of false signals.
Bearish Japanese candlesticks are an important tool in technical analysis of financial markets. They provide valuable information about the sentiments and actions of traders, and can help predict future price movements.
Read Also: 5 Year Forecast for GLD: What Can We Expect?
When a bearish Japanese candlestick is formed, it indicates that the opening price was higher than the closing price, and that sellers have dominated the market during the time period represented by the candlestick. This suggests that there is selling pressure and that the price may continue to decline.
There are several types of bearish Japanese candlesticks, each with its own significance and implications for trading strategies. Some common bearish candlestick patterns include the bearish engulfing pattern, the shooting star pattern, and the hanging man pattern.
Read Also: Understanding the Significance of Latency in Trading | Importance of Low Latency in Financial Markets
The bearish engulfing pattern occurs when a small bullish candlestick is followed by a larger bearish candlestick that engulfs its body. This pattern is often seen as a reversal signal, indicating that the uptrend is weakening and a downtrend may be imminent.
The shooting star pattern is characterized by a small body at the lower end of the candlestick and a long upper shadow. This pattern suggests that the market opened near its high, but ran out of buying pressure and closed lower, indicating a potential reversal to a downtrend.
The hanging man pattern is similar to the shooting star, but it occurs after an uptrend. It has a small body at the upper end of the candlestick and a long lower shadow. This pattern suggests that the market opened near its high, but sellers stepped in and pushed the price lower, indicating a potential trend reversal.
Understanding these bearish Japanese candlestick patterns is crucial for traders looking to develop effective trading strategies. By recognizing these patterns and their implications, traders can make informed decisions on when to enter or exit positions, set stop losses, or take profits.
It’s important to note that bearish Japanese candlesticks should not be used in isolation. They should be combined with other technical indicators and analysis tools to confirm or validate signals. Additionally, traders should always consider the overall market conditions and factors that may influence price movements.

Bearish Japanese candlesticks are a type of chart pattern that indicates a potential reversal in the price of an asset. These candlesticks have a longer upper shadow and a shorter or no lower shadow, indicating that sellers have taken control and pushed the price down.
Bearish Japanese candlesticks can have a significant impact on trading as they indicate a potential reversal in the price trend. When these candlesticks appear, it suggests that the market sentiment is turning bearish and it may be a good time for traders to consider selling or shorting the asset.
Yes, there are several trading strategies that can be used with bearish Japanese candlesticks. Some popular strategies include the bearish engulfing pattern, the evening star pattern, and the shooting star pattern. These strategies involve identifying specific candlestick patterns and using them as signals to enter or exit trades.
Traders can use bearish Japanese candlesticks to make informed trading decisions by considering the overall market trend and looking for confirmation signals. If a bearish candlestick pattern appears during a downtrend or near a significant resistance level, it can be a stronger signal of a potential reversal. Traders can also use other technical indicators and analysis to confirm the bearish signals.
Yes, bearish Japanese candlesticks can be used in combination with other chart patterns and indicators to enhance trading strategies. For example, traders may look for bearish candlestick patterns that align with a bearish divergence in an oscillator indicator, or combine them with support and resistance levels to increase the probability of successful trades.
Bearish Japanese candlesticks are chart patterns used in technical analysis to predict a possible reversal or continuation of a downtrend in the price of a financial instrument. They are part of the candlestick charting techniques developed in Japan and are widely used in the field of technical analysis. These candlestick patterns provide visual cues that indicate a potential bearish move in the market.

Exploring Stop Loss Hunting in Forex Market Forex stop loss hunting is a practice that many traders are familiar with. It refers to a situation where …
Read Article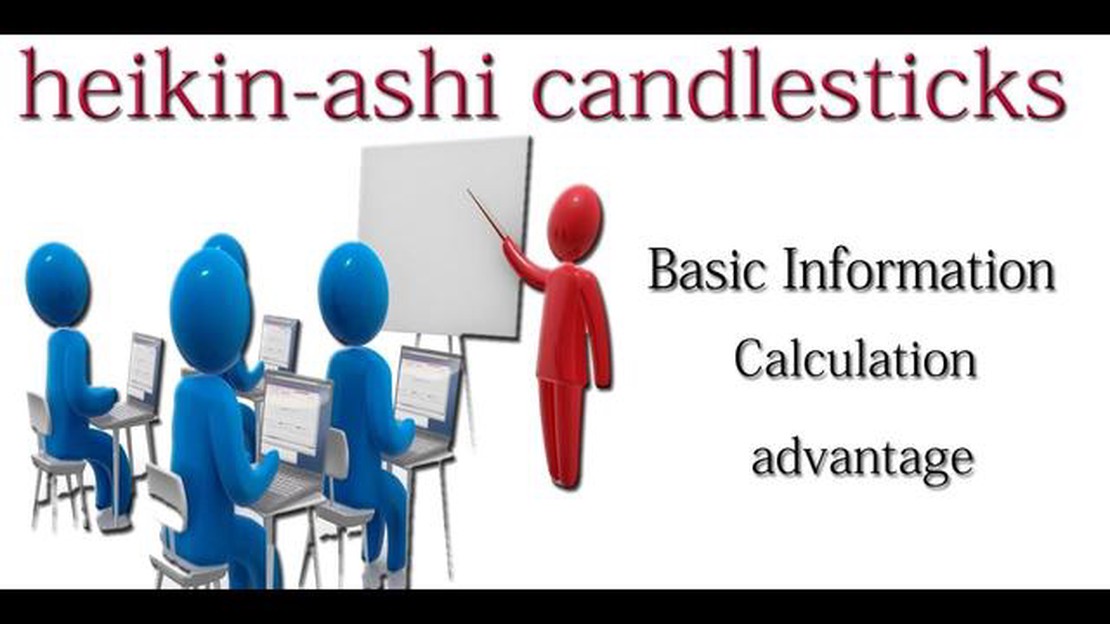
How to Calculate Heikin Ashi in Excel? If you’re a trader looking to improve your technical analysis skills, understanding and calculating the Heikin …
Read Article
Is it possible to negotiate solicitors fees? When dealing with legal matters, the cost of hiring a solicitor can be a significant concern. The fees …
Read Article
Interactive Brokers: Trading Platform Review If you’re in the market for a reliable and comprehensive trading platform, you may be considering …
Read Article
IC Markets raw spread charges IC Markets is a leading online forex broker known for its competitive pricing and transparent trading conditions. With …
Read Article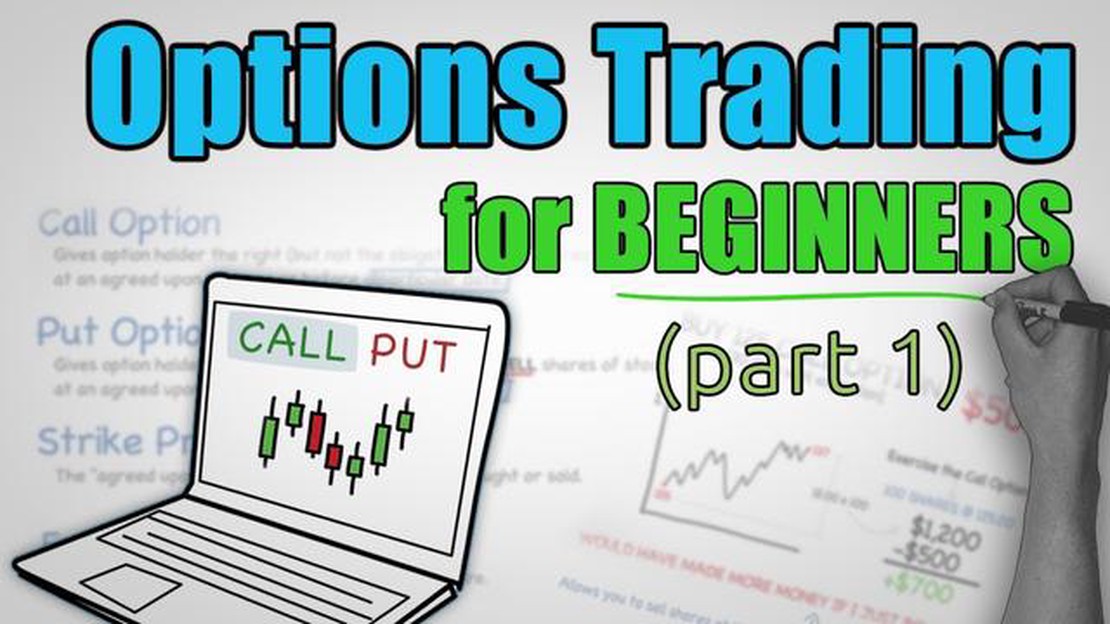
Trading Stock Options in the UK: A Comprehensive Guide Stock options are a popular form of compensation in the United Kingdom, especially for …
Read Article


