
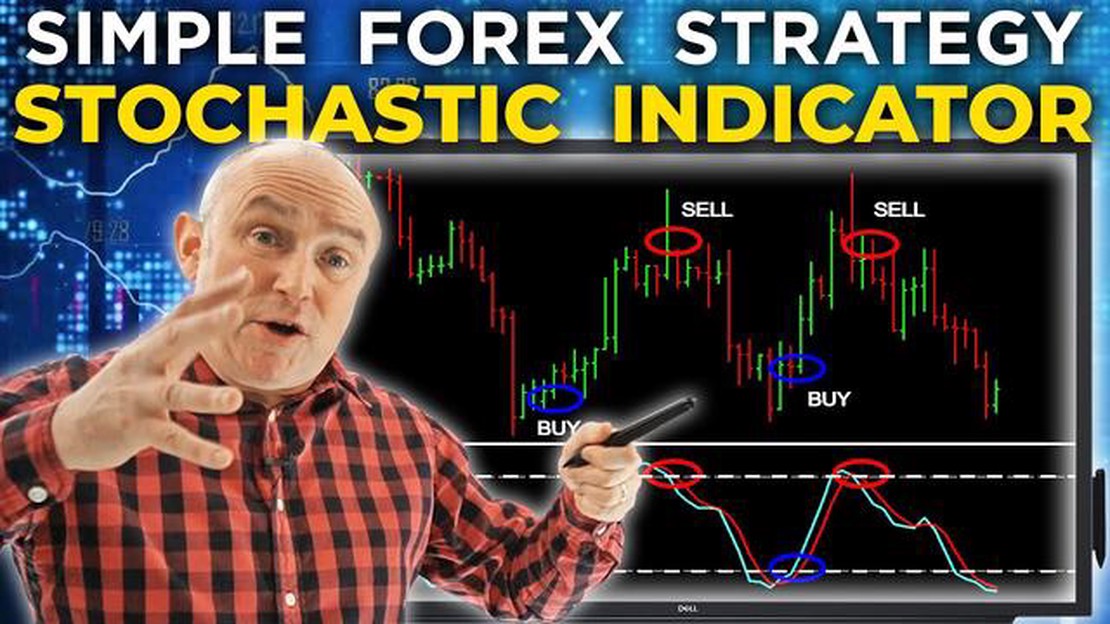

Learn how to trade forex with stochastic indicator for maximum profits
Trading forex with the stochastic indicator Are you looking to maximize your profits in the forex market? One way to do this is by utilizing the …
Read Article

When it comes to trading, understanding and utilizing technical analysis tools can greatly improve your chances of success. One such tool that has gained popularity among traders is Fibonacci levels. This comprehensive guide will provide you with a deep understanding of Fibonacci levels and how to use them effectively in your trading strategies.
What are Fibonacci levels?
Fibonacci levels are a series of horizontal lines that serve as potential support and resistance levels on a trading chart. These levels are derived from mathematical ratios that have been discovered by the famous Italian mathematician, Leonardo Fibonacci. The most commonly used Fibonacci levels are 38.2%, 50%, and 61.8%.
Why are Fibonacci levels important in trading?
Fibonacci levels are important in trading because they can help traders identify key levels of support and resistance. These levels are significant because they often coincide with the psychological levels where traders are likely to enter or exit positions. By using Fibonacci levels, traders can make more informed decisions on when to buy or sell, resulting in better trading outcomes.
How to use Fibonacci levels in your trading strategies?
There are several ways to use Fibonacci levels in your trading strategies. One common approach is to use them to identify potential entry and exit points. When a security is in an uptrend, traders can look for opportunities to buy when the price retraces to a Fibonacci support level. Conversely, in a downtrend, traders can consider selling when the price rallies to a Fibonacci resistance level.
Another popular strategy is to use Fibonacci extension levels to set profit targets. Traders can use these levels to identify potential price targets when a security is making new highs or lows. By setting profit targets using Fibonacci extension levels, traders can take profits at key levels and maximize their potential returns.
In conclusion, Fibonacci levels can be a valuable tool in a trader’s arsenal. By understanding how to identify and use these levels effectively, traders can make more informed trading decisions and potentially increase their profitability in the market.

Fibonacci levels are a set of horizontal lines drawn on a trading chart that indicate potential support and resistance levels based on the Fibonacci sequence. The Fibonacci sequence is a mathematical pattern that is found in nature and has been applied to various fields, including trading.
Traders use Fibonacci levels to identify potential price levels where they can enter or exit a trade. These levels are derived from the Fibonacci ratio, which is obtained by dividing a number in the sequence by the number that precedes it.
The main Fibonacci levels used in trading are 0.236, 0.382, 0.500, 0.618, and 0.786. These levels are considered significant because they represent retracement levels where price often finds support or encounters resistance. Traders often use these levels to set their profit targets or stop-loss orders.
To draw Fibonacci levels, traders start by identifying a significant swing high and swing low on a chart. They then draw the levels based on these two points, with the 0% level corresponding to the swing low and the 100% level corresponding to the swing high. The other Fibonacci levels are drawn as horizontal lines at the key retracement levels.
Read Also: Find out the Top Forex Broker Offering Trading with Just 1 USD
It is important to note that Fibonacci levels are not exact price levels, but rather areas where price is likely to react. Therefore, traders should use Fibonacci levels in conjunction with other technical analysis tools to confirm potential trading opportunities.
Overall, Fibonacci levels are a popular tool among traders to identify potential support and resistance levels. By incorporating these levels into their trading strategies, traders can have a better understanding of where price might reverse or continue its trend.
Using Fibonacci levels in trading can be a powerful tool for identifying potential entry and exit points. Traders often rely on these levels to determine areas of support and resistance, as well as to gauge potential price reversals. Here are some steps on how to effectively use Fibonacci levels in your trading strategy:
1. Identify the trend: Before applying Fibonacci levels, it is essential to determine the prevailing trend. This can be done by analyzing price charts or using technical indicators. Fibonacci retracements are commonly used in trending markets, while Fibonacci extensions are more suitable for identifying potential price targets in an ongoing trend.
Read Also: Using Meta Trader on iPhone: The Complete Guide
2. Select the swing high and swing low points: To draw Fibonacci levels, you need to identify two significant points on your chart - a swing high and a swing low. The swing high is the highest point reached during an uptrend, and the swing low is the lowest point reached during a downtrend.
3. Calculate the Fibonacci levels: Once you have identified the swing high and swing low points, you can calculate the Fibonacci levels. The most commonly used levels are 38.2%, 50%, and 61.8%. These levels can act as potential areas of support and resistance, where price may find difficulty breaking through.
4. Monitor price action near Fibonacci levels: Pay close attention to how price reacts near the Fibonacci levels you have drawn. If price bounces off a Fibonacci retracement level, it could indicate a potential reversal or a continuation of the trend. Conversely, if price breaks through a Fibonacci retracement level, it may suggest a trend reversal or a breakout.
5. Combine Fibonacci levels with other technical tools: Fibonacci levels work best when used in conjunction with other technical analysis tools such as trend lines, moving averages, or oscillators. These additional tools can help confirm potential entry and exit points based on the Fibonacci levels.

6. Practice and refine your strategy: Like any trading tool, using Fibonacci levels requires practice and experimentation. By backtesting your strategy and analyzing how price reacts to Fibonacci levels in historical data, you can refine your approach and develop a more effective trading strategy.
Overall, Fibonacci levels can provide valuable insights into potential price levels and market trends. Incorporating these levels into your trading strategy can help you make more informed trading decisions and improve your overall trading performance.
Fibonacci trading is a strategy that involves using Fibonacci retracement and extension levels to identify potential support and resistance areas in a financial market. It works by drawing horizontal lines on a price chart at specific Fibonacci levels and using these lines to identify potential entry and exit points for trades.
Fibonacci retracement levels are horizontal lines drawn on a price chart at specific Fibonacci ratios, such as 38.2% and 61.8%. These levels are used in trading to identify potential support and resistance areas where price may reverse or consolidate. Traders use these levels to enter trades at favorable prices and to set stop-loss orders.
To identify Fibonacci retracement levels on a price chart, you need to first identify a significant high and low on the chart. Then, you draw a Fibonacci retracement tool from the high to the low, which will automatically plot the retracement levels on the chart. These levels can then be used to analyze potential areas of support and resistance.
Fibonacci extension levels are horizontal lines drawn on a price chart at specific Fibonacci ratios, such as 161.8% and 261.8%. These levels are used in trading to identify potential areas of price extension beyond the initial trend. Traders use these levels to set profit targets for their trades or to identify potential areas where price may reverse.
Yes, there are many trading strategies that can be used in combination with Fibonacci levels. Some common strategies include trend following, breakout trading, and harmonic pattern trading. Traders often use Fibonacci levels in combination with other technical indicators and patterns to confirm trading signals and improve the accuracy of their trades.
Fibonacci levels are horizontal lines on a price chart that are used to identify potential support and resistance levels based on the Fibonacci sequence.

Trading forex with the stochastic indicator Are you looking to maximize your profits in the forex market? One way to do this is by utilizing the …
Read Article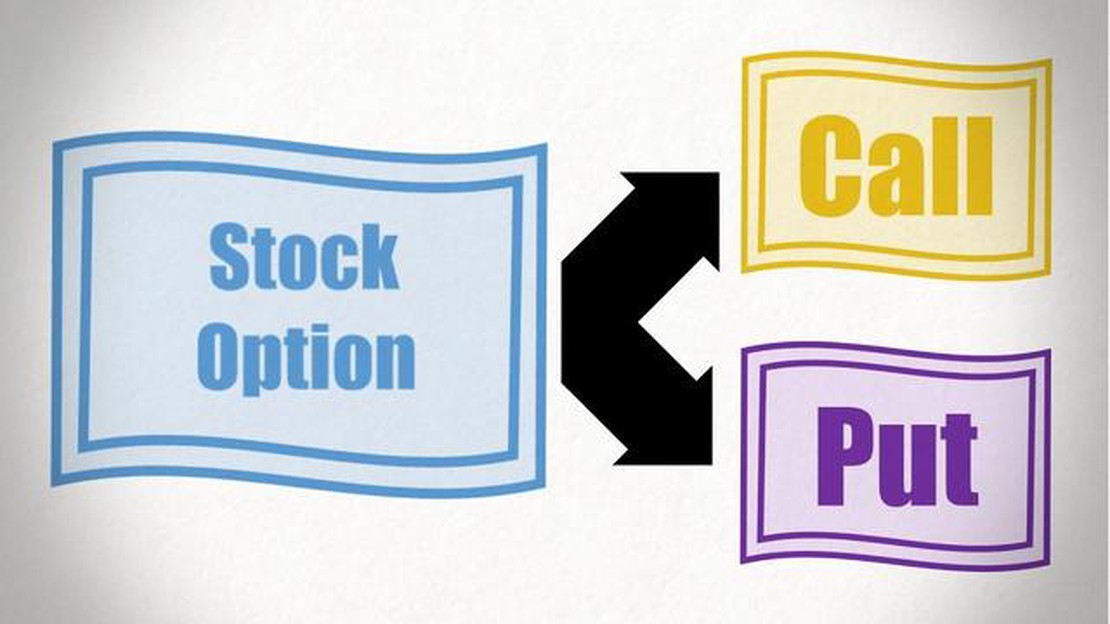
Understanding the Mechanics of Equity Stock Options Equity stock options are an integral part of the financial world, offering individuals and …
Read Article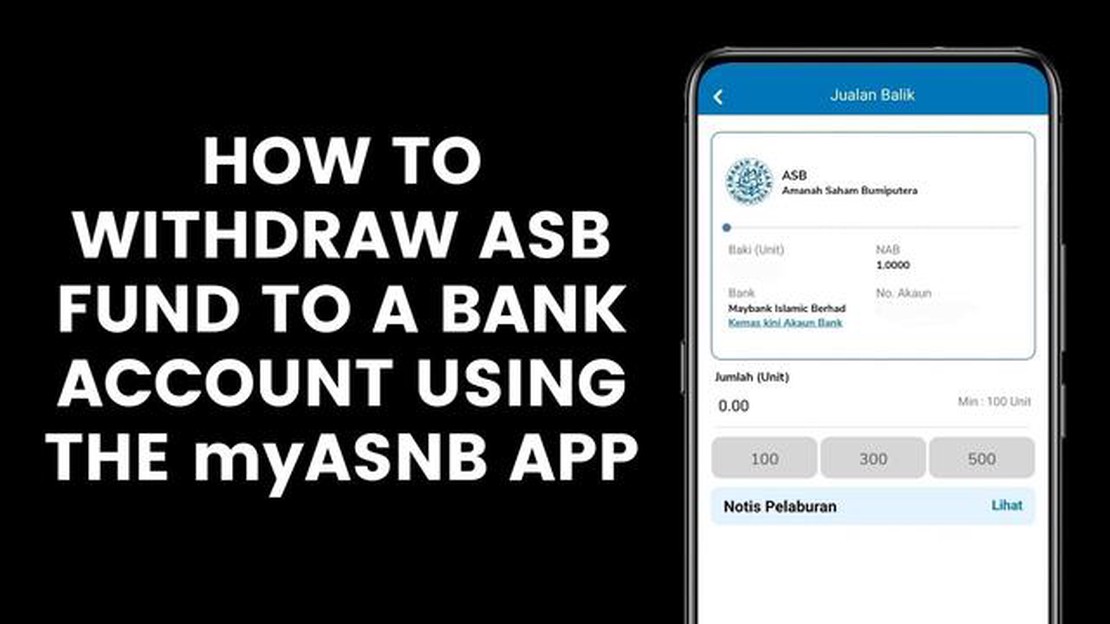
How much money can you withdraw from ASB per day? Do you ever find yourself needing to withdraw a large amount of cash from your ASB account? If so, …
Read Article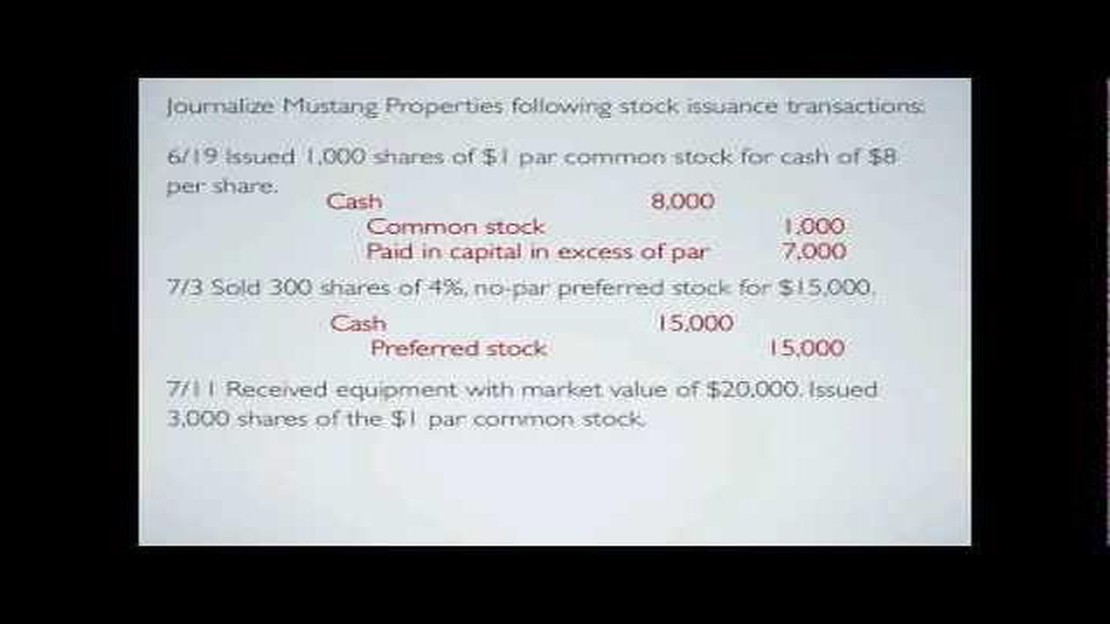
Understanding Paid-In Capital Stock Options When it comes to understanding the financial structure of a corporation, one term that often appears is …
Read Article
Trading American Options in India: Everything You Need to Know If you’re an investor in India, you may be wondering whether you can trade American …
Read Article
Where Can I Get Tick Data for Free? When it comes to trading and investing, having access to accurate and reliable tick data is essential. Tick data …
Read Article

