

What happens if you receive a day trading margin call?
Consequences of Receiving a Day Trading Margin Call Day trading is a popular strategy that involves buying and selling financial instruments within …
Read Article
When it comes to investing in the stock market, it’s important to have a strategy in place. One key element of a successful strategy is the use of indicators. Indicators are tools that help investors analyze and predict market trends.
There are several indicators that investors can use to make informed decisions about buying and selling stocks. One of the most popular indicators is the moving average. The moving average is a line that represents the average price of a stock over a specific period of time. When the price of a stock crosses above the moving average, it may signal a buying opportunity. Conversely, when the price crosses below the moving average, it may indicate a selling opportunity.
Another useful indicator is the relative strength index (RSI). The RSI is a momentum oscillator that measures the speed and change of price movements. It is used to identify overbought and oversold conditions in a stock. When the RSI reaches a high level, it may indicate that the stock is overbought and due for a price correction. On the other hand, when the RSI reaches a low level, it may suggest that the stock is oversold and could be poised for a price rebound.
It’s important to note that no single indicator should be used in isolation. Instead, investors should use a combination of indicators to get a more complete picture of the market. This can help to filter out false signals and increase the accuracy of buy and sell decisions.
Other popular indicators include the MACD (Moving Average Convergence Divergence), Bollinger Bands, and the Stochastic Oscillator. Each indicator has its own unique calculation and interpretation, providing different insights into market trends. By understanding and using these indicators effectively, investors can increase their chances of success in the stock market.
Stock trading can be a complex and volatile market, but with the right indicators, investors can gain an edge and make informed decisions. These indicators can help traders to identify trends, predict price movements, and find profitable entry and exit points. Here are some of the top indicators that traders use for stock trading:
1. Moving Averages
Moving averages are one of the most widely used indicators in stock trading. They help traders to smooth out price data and identify trend direction. The two most common types of moving averages are the simple moving average (SMA) and the exponential moving average (EMA). SMA calculates the average price over a specific period, while EMA gives more weight to recent prices.
2. Relative Strength Index (RSI)
The RSI is a momentum oscillator that measures the speed and change of price movements. It compares the magnitude of recent gains to recent losses to determine whether a stock is overbought or oversold. Traders often use the RSI to identify potential reversal points.
3. Bollinger Bands

Bollinger Bands consist of a simple moving average and two standard deviation bands. They help traders identify volatility and overbought or oversold conditions. When the price touches or crosses the upper band, it may indicate that the stock is overbought and due for a reversal. Conversely, when the price touches or crosses the lower band, it may indicate that the stock is oversold and due for a bounce.
4. MACD (Moving Average Convergence Divergence)
Read Also: What is HFM trading? Discover the key aspects of High-Frequency Market trading
The MACD is a trend-following momentum indicator that shows the relationship between two moving averages of a stock’s price. It consists of a MACD line and a signal line. When the MACD line crosses above the signal line, it generates a bullish signal, indicating that it may be a good time to buy. Conversely, when the MACD line crosses below the signal line, it generates a bearish signal, indicating that it may be a good time to sell.
5. Volume
Volume is a key indicator in stock trading as it provides insight into the strength of a price movement. High trading volume often accompanies significant price movements, indicating increased investor interest. Traders use volume to confirm price trends and identify potential reversals.
6. Fibonacci Retracement
Fibonacci retracement levels are horizontal lines that indicate potential support and resistance levels based on Fibonacci ratios. These levels are calculated using the Fibonacci sequence and are popular among traders. They can help traders identify potential levels where a stock’s price may reverse.
It’s important to note that while indicators can be helpful, they should not be relied upon solely for making trading decisions. It’s crucial to combine indicators with other forms of analysis and to consider other factors such as market news and company fundamentals.
Read Also: Reasons why certain stocks do not provide options trading
By using these top indicators for stock trading, traders can enhance their decision-making process and potentially increase their chances of success in the market.
When it comes to buying and selling stocks, one of the key elements in the decision-making process is the evaluation of the company itself. Fundamental analysis is a method used to evaluate a company’s financial health and potential for growth.

Here are some important factors to consider when performing fundamental analysis:
By considering these factors and performing thorough fundamental analysis, investors can make informed decisions when buying and selling stocks. It is important to note that fundamental analysis should be combined with other indicators and techniques to form a comprehensive investment strategy.
There are several key indicators to consider when buying and selling stocks. Some of the most commonly used indicators include moving averages, relative strength index (RSI), volume, and MACD (Moving Average Convergence Divergence).
Moving averages are used to identify the overall trend of a stock. The most commonly used moving averages are the 50-day and 200-day moving averages. When the price of a stock is above its moving average, it is considered to be in an uptrend, and when it is below its moving average, it is considered to be in a downtrend.
The relative strength index (RSI) is a momentum oscillator that measures the speed and change of price movements. It ranges from 0 to 100 and is typically used to identify overbought or oversold conditions in a stock. When the RSI is above 70, it is considered overbought and when it is below 30, it is considered oversold.
Volume is an important indicator because it provides insight into the level of interest and activity in a stock. Higher volume usually indicates greater buying or selling pressure, which can be a signal of a trend reversal. Low volume, on the other hand, may indicate a lack of interest or indecision in the market.
MACD (Moving Average Convergence Divergence) is a popular technical indicator that shows the relationship between two moving averages of a stock’s price. It consists of a MACD line, a signal line, and a histogram. Traders use MACD to identify potential buy or sell signals when the MACD line crosses above or below the signal line. The histogram also helps to visualize the strength of the momentum.
Some top indicators that can be used for buying and selling stocks include moving averages, relative strength index (RSI), stochastic oscillator, and the MACD indicator.
Moving averages can be used as an indicator for buying and selling stocks by analyzing the trend of the stock price. When the stock price crosses above a moving average, it may be a signal to buy, while when it crosses below a moving average, it may be a signal to sell.

Consequences of Receiving a Day Trading Margin Call Day trading is a popular strategy that involves buying and selling financial instruments within …
Read Article
Owner of MBA forex When it comes to the world of finance and investments, one name that stands out is MBA Forex. This renowned company has made its …
Read Article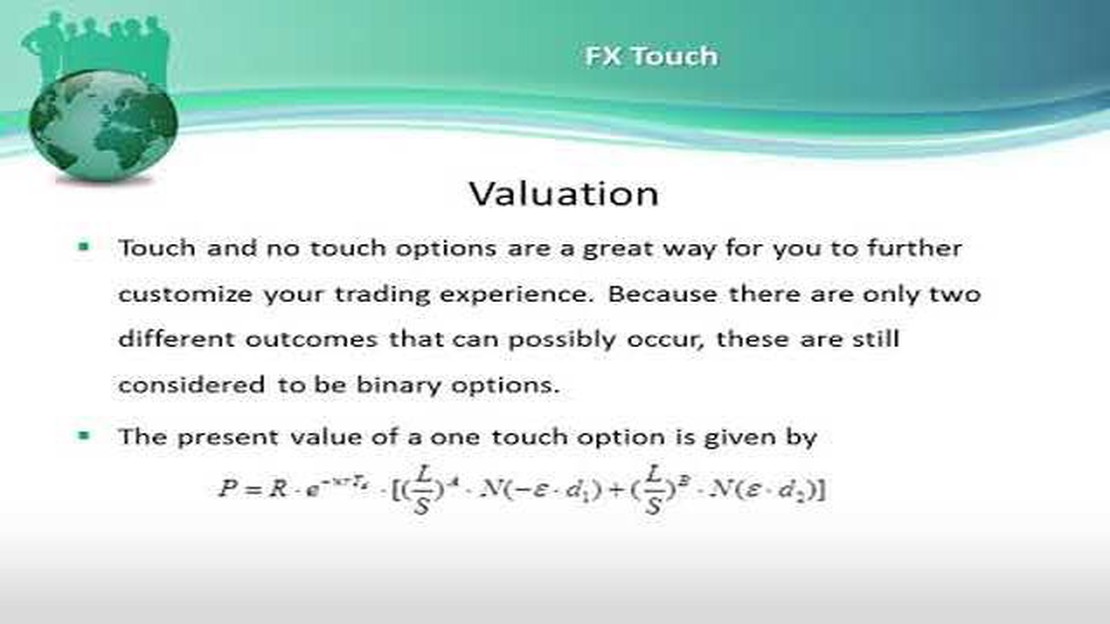
Understanding Touch Options: A Complete Guide Touch options are a type of financial instrument that offers a unique way of trading. They provide …
Read Article
Who is the Wealthiest Forex Trader? Forex trading, also known as foreign exchange trading, is a lucrative endeavor that has the potential to make …
Read Article
Wyckoff Trading Strategy: Is It the Best Approach to Trading? When it comes to trading strategies, there are countless options to choose from. One …
Read Article
How to Calculate the Moneyness of an Option An option is a financial derivative that gives the holder the right, but not the obligation, to buy or …
Read Article


