
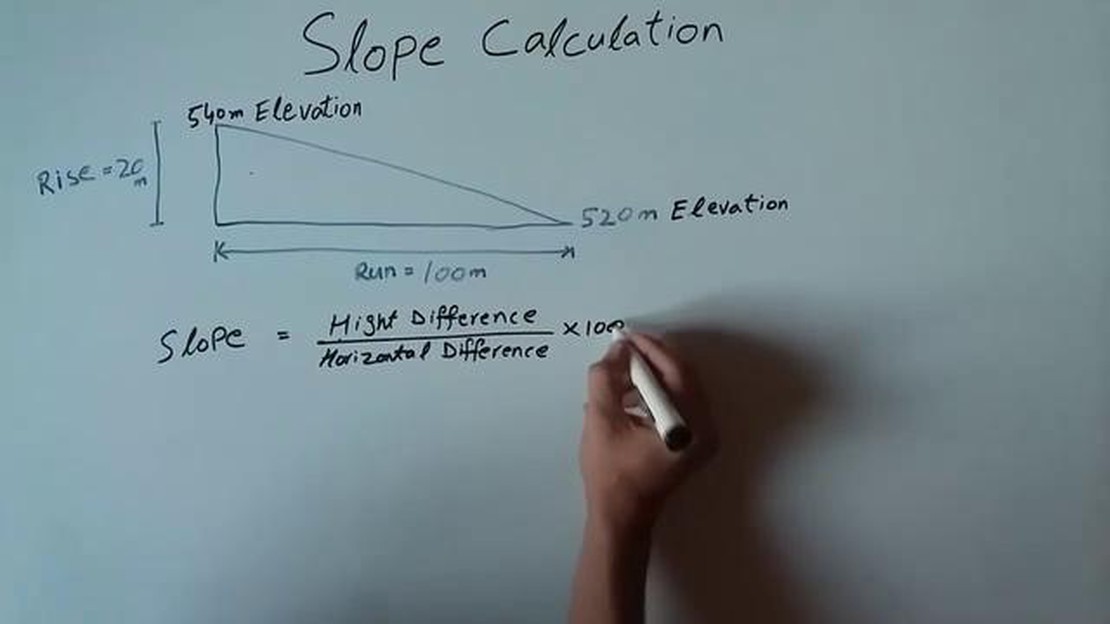

Calculating Price Slope: A Step-by-Step Guide
How to Calculate Price Slope Gaining insights into price trends can be crucial for businesses and investors. One powerful tool for understanding these …
Read Article
When it comes to trading in the financial markets, having a reliable and accurate indicator is crucial for making informed decisions. One widely used indicator by traders is the Moving Average Convergence Divergence (MACD), which can help identify potential trend reversals, momentum shifts, and divergences. However, selecting the best combination of MACD settings for your specific trading style and goals is essential for maximizing its effectiveness.
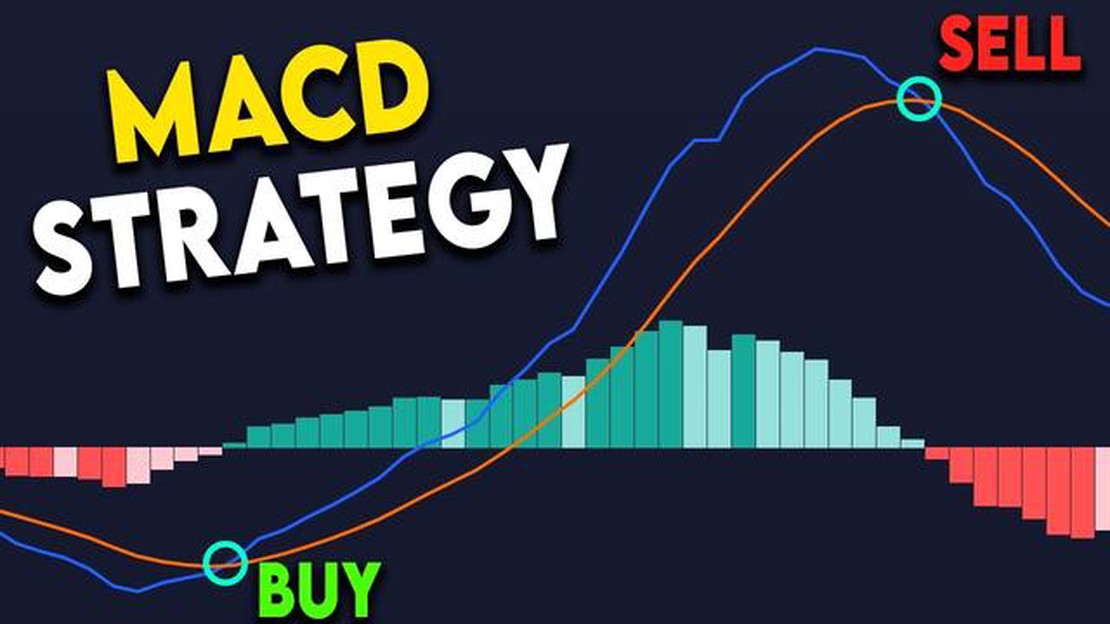
The MACD indicator is composed of three components: the MACD line, the signal line, and the histogram. The MACD line is calculated by subtracting the 26-day Exponential Moving Average (EMA) from the 12-day EMA. The signal line is a 9-day EMA of the MACD line, while the histogram represents the difference between the MACD line and the signal line.
Choosing the right combination of MACD settings requires considering several factors, such as your trading timeframe, the financial instrument you trade, and your risk tolerance. Shorter-term traders may opt for faster settings, such as 8, 17, and 9, to capture quicker price movements. Longer-term traders, on the other hand, may prefer slower settings, such as 21, 34, and 9, to filter out market noise and focus on broader trends.
Keep in mind that the optimal MACD settings can vary depending on the market conditions and the specific trading strategy you employ. It is crucial to experiment with different settings and thoroughly backtest them before incorporating them into your trading plan.
In addition to adjusting the MACD settings, combining it with other indicators can further enhance its effectiveness. For instance, some traders use the MACD in conjunction with other trend-following indicators like the Moving Averages or the Relative Strength Index (RSI) for confirmation. This combination can provide more reliable signals and filter out false signals.
Remember that finding the best MACD indicator combination is not a one-size-fits-all approach. It requires careful analysis, experimentation, and customization to suit your specific trading needs. By combining the MACD with other indicators and adjusting the settings to align with your trading style, you can significantly improve your trading decisions and increase your chances of success in the markets.
The MACD (Moving Average Convergence Divergence) indicator is a popular technical analysis tool used by traders to identify potential buy and sell signals in the financial markets. It is a versatile indicator that can be used on various timeframes and asset classes.
While the MACD indicator is powerful on its own, combining it with other indicators can greatly enhance its effectiveness. The use of multiple indicators helps to confirm trends, identify reversals, and filter out false signals.
One of the main benefits of combining the MACD indicator with other indicators is that it provides a more comprehensive view of the market. By analyzing multiple indicators, traders can get a clearer picture of market conditions and make more informed trading decisions.
Another advantage of using a combination of indicators is that it can help to reduce false signals. The MACD indicator, like any other technical indicator, is not 100% accurate and can produce false signals from time to time. By using other indicators to confirm the signals generated by the MACD, traders can filter out false signals and increase the accuracy of their trading strategies.
Furthermore, using a combination of indicators can help to identify market reversals. The MACD indicator is effective in identifying trends, but it may not be as effective in identifying when a trend is about to reverse. By combining the MACD with other indicators such as the RSI (Relative Strength Index) or the Stochastic Oscillator, traders can get a better sense of when a trend is losing momentum and a reversal may occur.

Overall, the combination of the MACD indicator with other indicators is crucial for maximizing its effectiveness and minimizing false signals. Traders should experiment with different combinations of indicators to find the ones that work best for their trading style and preferences.
The Moving Average Convergence Divergence (MACD) indicator is comprised of several components that work together to provide valuable insights into market trends and potential trading opportunities. By understanding these components, traders can effectively interpret the MACD indicator and make informed trading decisions.
The MACD indicator consists of the following components:
Read Also: Did High-Speed Trader Simplex Warn About Potentially Abusive Options Strategy?
| 1. MACD Line | The MACD line is the primary indicator line and is calculated by subtracting the 26-day exponential moving average (EMA) from the 12-day EMA. It represents the difference between the short-term and long-term moving averages. |
| 2. Signal Line | The signal line is a 9-day EMA of the MACD line. It is used to generate trading signals and confirm trend reversals. When the MACD line crosses above the signal line, it is considered a bullish signal, indicating a potential buying opportunity. Conversely, when the MACD line crosses below the signal line, it is considered a bearish signal, indicating a potential selling opportunity. |
| 3. MACD Histogram | The MACD histogram represents the difference between the MACD line and the signal line. It provides a visual representation of the convergence and divergence between the two lines. When the histogram bars are positive, it indicates bullish momentum, while negative bars indicate bearish momentum. Traders often look for divergences between the histogram and the price chart to identify potential trend reversals. |
By analyzing and interpreting these components, traders can gain valuable insights into market trends and potential trading opportunities. The MACD indicator is widely used by traders to identify potential buy and sell signals, confirm trends, and signal trend reversals. However, it is important to note that the MACD indicator should be used in conjunction with other technical indicators and analysis tools to make more accurate trading decisions.
When it comes to choosing the best MACD indicator combination, there are several factors to consider. These factors can help you determine which combination is most suitable for your trading strategy and goals. Below are some key factors to keep in mind:
1. Timeframe: The timeframe you trade on can significantly impact the MACD indicator combination you choose. Different timeframes have different levels of accuracy and reliability, so it’s important to select a combination that aligns with your preferred timeframe.
Read Also: Understanding the Taxation of RSUs in Belgium: All You Need to Know
2. Volatility: Consider the market’s volatility when selecting a MACD indicator combination. A combination that works well in a highly volatile market may not be as effective in a less volatile market. Take into account the average true range (ATR) and other volatility indicators to choose the most appropriate combination for the current market conditions.
3. Trend Identification: MACD indicators can help identify trends in the market. It’s crucial to choose a combination that accurately identifies the direction and strength of trends. Look for combinations that have shown consistent and reliable signals in past trends.
4. Confirmation from Other Indicators: To increase the reliability of your trading signals, consider using other indicators in conjunction with the MACD. This can help confirm the signals generated by the MACD and reduce false signals. Experiment with different combinations of indicators to find the most effective combination for your trading strategy.

5. Personal Preference: Ultimately, your personal trading style and comfort level should also play a role in selecting a MACD indicator combination. Experiment with different combinations and see which ones align with your trading approach and preferences. Trust your instincts and choose a combination that you feel confident using.
In conclusion, when choosing a MACD indicator combination, consider the timeframe, volatility, trend identification, confirmation from other indicators, and your personal preference. Remember to thoroughly test different combinations and analyze their historical performance before implementing them in live trading. The right combination can greatly enhance your trading strategy and improve your overall results.
MACD (Moving Average Convergence Divergence) indicator combination refers to the use of multiple MACD indicators together to generate trading signals.
To find the best MACD indicator combination, you can experiment with different settings and parameters such as the periods for the fast and slow moving averages, as well as the signal line. It’s important to find a combination that works well with the specific market or asset you are trading.
Some commonly used MACD indicator combinations include the MACD crossover strategy, where traders look for the MACD line to cross above or below the signal line. Another popular combination is using multiple timeframes, such as combining the MACD signals from a longer-term chart with a shorter-term chart.
Yes, the MACD indicator combination can be used for any market, including stocks, forex, commodities, and cryptocurrencies. However, it’s important to test and optimize the combination for each specific market, as different markets may require different settings.
While MACD indicator combinations can be effective in generating trading signals, there are some drawbacks to consider. One drawback is that they can sometimes produce false signals, especially in choppy or sideways markets. It’s also important to note that past performance is not always indicative of future results, so it’s important to use the MACD combination in conjunction with other technical analysis tools and risk management strategies.
MACD (Moving Average Convergence Divergence) is a popular technical analysis indicator used to identify potential buy and sell signals in a financial instrument. It consists of two lines, the MACD line and the signal line, which are calculated based on the difference between two moving averages.
The MACD indicator can be used in several ways. One common method is to look for a crossover between the MACD line and the signal line. When the MACD line crosses above the signal line, it is considered a bullish signal, indicating a potential buy opportunity. Conversely, when the MACD line crosses below the signal line, it is considered a bearish signal, indicating a potential sell opportunity. Traders can also look for divergence between the MACD line and the price of the financial instrument, which can indicate a possible trend reversal.

How to Calculate Price Slope Gaining insights into price trends can be crucial for businesses and investors. One powerful tool for understanding these …
Read Article
Does BMO offer trading services? Bank of Montreal (BMO) is one of the biggest banks in Canada, providing a range of financial services to its …
Read Article
What is the average monthly income of options traders? Options trading offers an exciting opportunity to generate income and potentially achieve …
Read Article
Why is Ibkr margin so low? Interactive Brokers (IBKR) is renowned for its low margin rates, which has attracted many traders to the platform. While …
Read Article
Understanding the Process of Exercising Stock Options Stock options are a common form of compensation that many employers offer to their employees. …
Read Article
Are stock options considered income? Stock options are a popular form of compensation offered by many companies to their employees. These options give …
Read Article


