
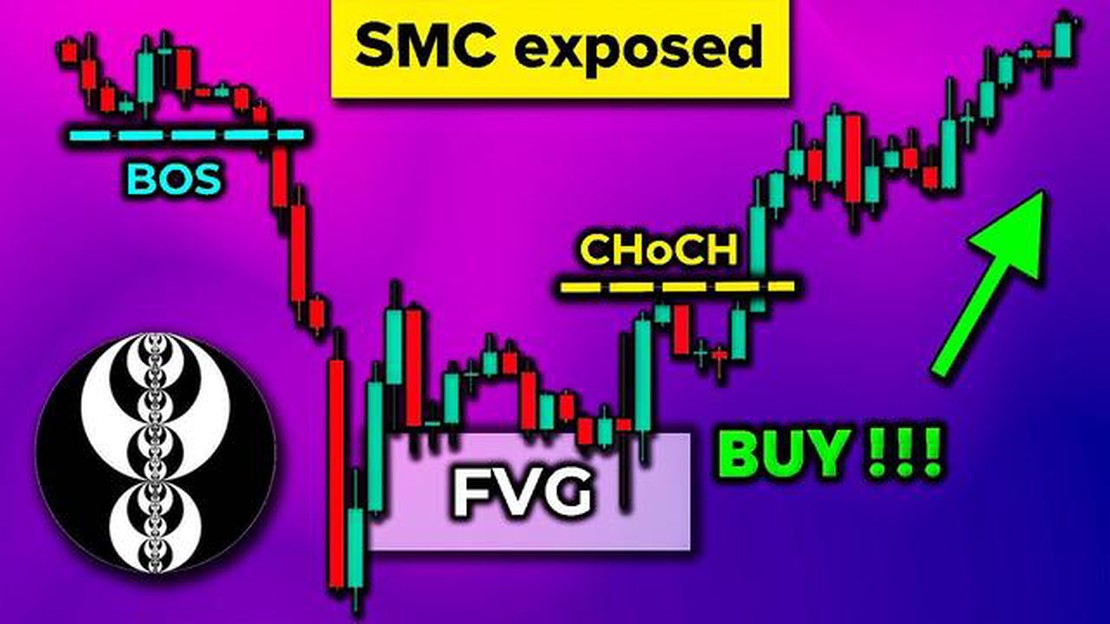

What is SMC Strategy in Trading? A Comprehensive Guide
Understanding SMC Strategy in Trading If you’re interested in the world of trading, you’ve probably come across the term SMC strategy. But what …
Read Article
Forex trading is a lucrative venture that requires traders to make informed decisions based on various data and analysis. One of the most important tools in a trader’s arsenal is the forex chart. Forex charts visually represent the price movements of currency pairs over time, allowing traders to identify trends, patterns, and potential trading opportunities.
There are several types of forex charts that every trader should be familiar with. Line charts are the most basic type, showing a simple line connecting the closing prices of a currency pair over a specific period. Candlestick charts provide more detailed information by displaying the opening, closing, high, and low prices for each time period. These charts are especially useful for identifying price changes and market sentiment.
Another type of chart that traders use is the bar chart. Bar charts display the same information as candlestick charts but use vertical lines to represent the high and low prices and small horizontal lines to indicate the opening and closing prices for each time period. These charts are useful for analyzing price volatility and patterns.
Finally, traders also use advanced charting techniques such as Renko charts, Point and Figure charts, and Ichimoku charts. These charts offer unique perspectives and can help traders identify support and resistance levels, trend reversals, and other trading signals. Traders should experiment with different chart types to find the one that suits their trading style and objectives.
Forex charts are essential tools for traders in the foreign exchange market. They provide valuable information that helps traders make informed decisions and analyze market trends. Here are some reasons why forex charts are important in trading:

In conclusion, forex charts are indispensable tools for traders in the foreign exchange market. They provide valuable insights into market trends, help in technical analysis, assist in trade planning, enable timing trades, and facilitate risk management. Traders who understand how to read and interpret forex charts have a significant advantage in making profitable trading decisions.
Candlestick charts are a popular tool used by forex traders to conduct technical analysis. They provide valuable insights into price movements and help traders identify trends, reversals, and potential entry and exit points. Understanding how to read and interpret candlestick charts is crucial for successful forex trading.
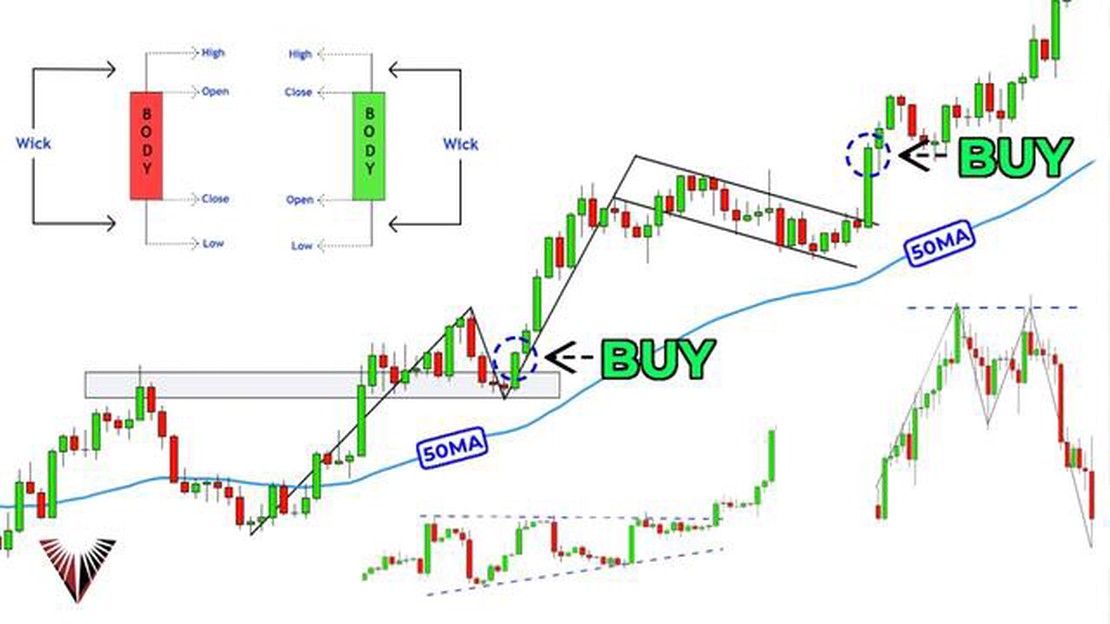
A candlestick chart consists of individual “candles” that represent a specific time period, such as minutes, hours, or days. Each candle has four main components: the open, high, low, and close prices.
Read Also: Best indicators to use with MFI: A comprehensive guide
The body of the candle represents the price range between the open and close. If the close is higher than the open, the body is typically filled or colored green, indicating a bullish or upward price movement. If the close is lower than the open, the body is usually empty or colored red, indicating a bearish or downward price movement.
The thin lines extending from the top and bottom of the body are called “wicks” or “shadows.” The upper wick represents the highest price reached during the time period, while the lower wick represents the lowest price reached. These wicks provide additional information about price volatility and the strength of the trend.
Traders often look for specific candlestick patterns to make trading decisions. For example, a “hammer” pattern with a small body and a long lower wick may indicate a potential bullish reversal, while a “shooting star” pattern with a small body and a long upper wick may suggest a possible bearish reversal.
It’s important to note that candlestick charts should not be used in isolation but in conjunction with other technical analysis tools, such as trend lines, moving averages, and indicators. By combining multiple indicators and patterns, traders can increase their chances of making profitable trades.
Read Also: Beginner's Guide: How to Start Systematic Trading in 5 Easy Steps
In conclusion, understanding candlestick charts is essential for forex analysis and trading. These charts provide valuable information about price movements and help traders identify potential entry and exit points. By studying different candlestick patterns and using them in conjunction with other technical analysis tools, traders can gain an edge in the forex market.
Forex charts are graphical representations of the price movement of currency pairs over a specific period of time. They provide insights into the historical and current market trends, allowing traders to analyze and interpret the market conditions.
There are several types of Forex charts, including line charts, bar charts, and candlestick charts. Line charts display the closing prices of a currency pair over time, while bar charts provide information on the opening, closing, high, and low prices. Candlestick charts display the same information as bar charts but are more visually appealing and provide additional patterns that can help predict future price movements.

Forex charts are crucial for traders as they provide valuable information about the historical and current price movements of currency pairs. By analyzing these charts, traders can identify patterns, trends, and market conditions that can help them make informed trading decisions. Charts also enable traders to determine entry and exit points, set stop-loss orders, and track the performance of their trades.
Traders can use Forex charts for technical analysis by studying various indicators, patterns, and trends. They can identify support and resistance levels, trendlines, and chart patterns such as double tops, head and shoulders, and triangles. Technical analysis using Forex charts can help traders forecast future price movements and make decisions based on historical data.
Candlestick charts offer several advantages in Forex trading. They provide more detailed information compared to line charts or bar charts, allowing traders to easily identify trends and patterns. Candlestick charts also offer a visual representation of market sentiment and can provide insights into potential reversals or continuation of trends. Additionally, candlestick charts are widely used and recognized by traders, making them a valuable tool in technical analysis.

Understanding SMC Strategy in Trading If you’re interested in the world of trading, you’ve probably come across the term SMC strategy. But what …
Read Article
Forex Simulator: Discover the Power of Virtual Trading For those interested in learning and practicing Forex trading, using a Forex simulator can be …
Read Article
Comparison of MFI and RSI indicators When it comes to technical analysis in the world of trading, two commonly used indicators are MFI (Money Flow …
Read Article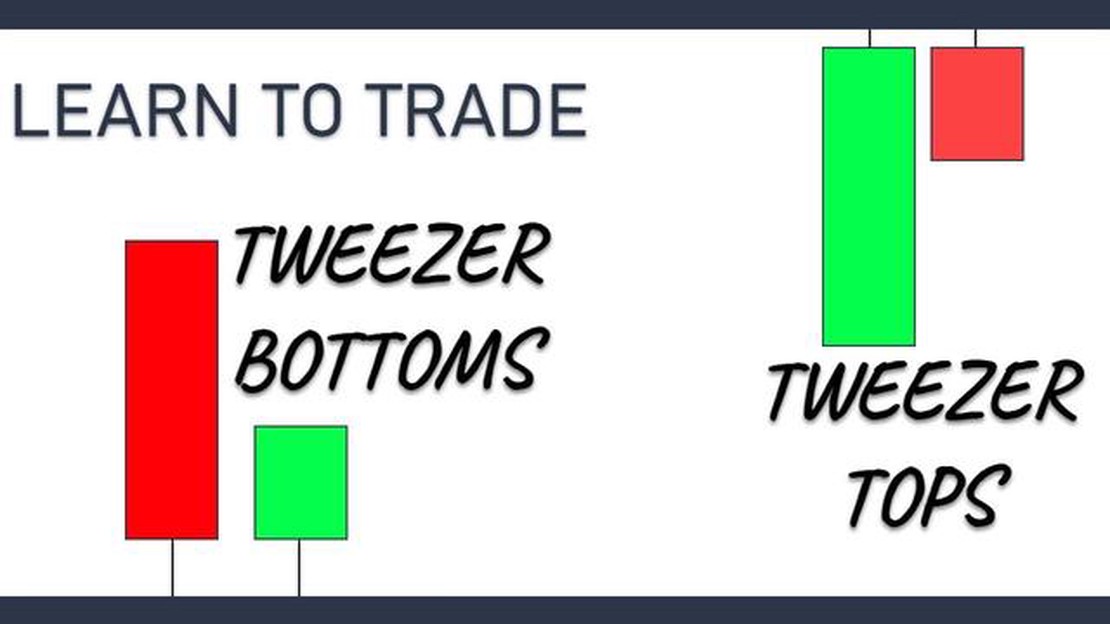
Understanding the Tweezer Top Pattern in Forex Trading When it comes to forex trading, understanding common candlestick patterns is essential for …
Read Article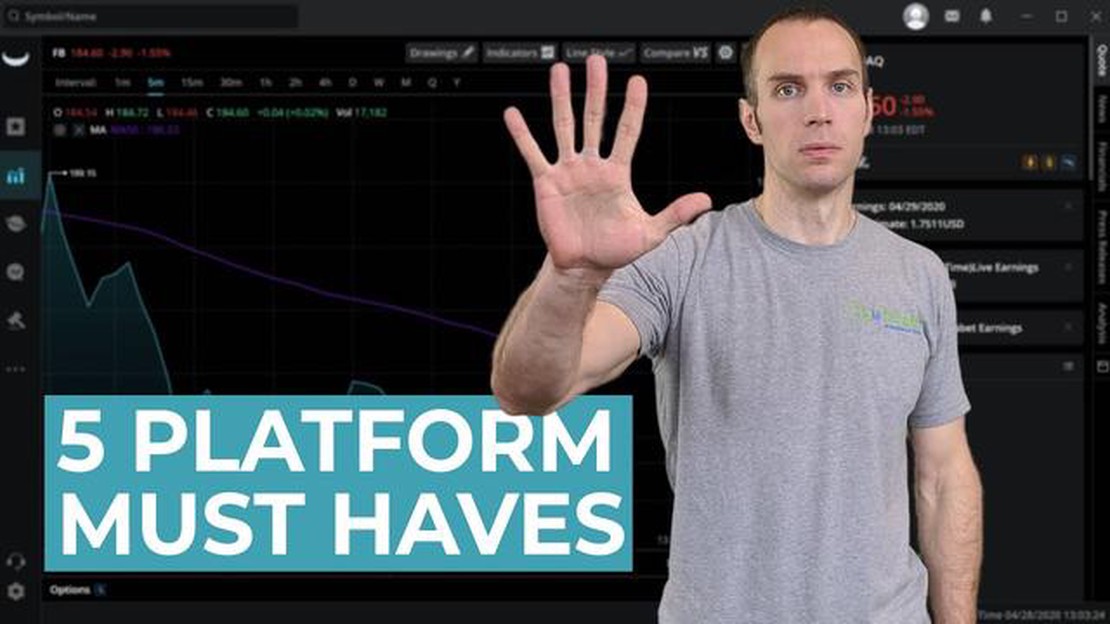
Best Online Trading Sites: A Comprehensive Guide to Find the Perfect Platform Online trading has become increasingly popular in recent years, with …
Read Article
How to Trade Options on the FTSE This comprehensive guide will provide you with all the information you need to successfully trade options in FTSE. …
Read Article


