

Does Azerbaijan have a fixed exchange rate?
Exchange Rate Policy in Azerbaijan: Is it Fixed? Azerbaijan, a country located at the crossroads of Eastern Europe and Western Asia, has a currency …
Read Article
Technical analysis is a powerful tool used by traders and investors to make informed decisions about the financial markets. One of the most commonly used indicators in technical analysis is the Exponential Moving Average (EMA). The EMA formula is a mathematical calculation that helps traders identify trends and potential trading opportunities.
The EMA formula calculates the average price of an asset over a specific time period, but gives more weight to the most recent prices. This means that the EMA reacts more quickly to changes in price compared to other moving averages, such as the Simple Moving Average (SMA). Traders use the EMA to spot trends, confirm reversals, and generate buy or sell signals.
So, how is the EMA formula calculated?
First, you need to choose a specific time period (e.g. 10 days, 20 days, etc.) for your EMA calculation. Next, you need to calculate the multiplier, which determines the weight given to each price point. The most commonly used multiplier is 2/(n+1), where n is the number of periods chosen. Finally, you apply the EMA formula to each price point in the chosen time period:
EMA = (Price - Previous EMA) * Multiplier + Previous EMA
The EMA formula is a powerful tool that can help traders spot trends and potential trading opportunities in the financial markets. By giving more weight to recent prices, the EMA reacts more quickly to price changes, making it a popular choice among traders. Whether you are a beginner or an experienced trader, understanding the EMA formula and how to use it can greatly improve your trading skills.
The Exponential Moving Average (EMA) is a powerful tool used in technical analysis to identify trends and potential entry and exit points in the financial markets. Unlike the Simple Moving Average (SMA), which gives equal importance to all data points, the EMA puts more weight on recent data, making it more responsive to current market conditions.
The formula for calculating the EMA involves applying a smoothing constant to the previous EMA value and adding it to a percentage of the difference between the current price and the previous EMA value. This constant is determined by the time period chosen for the EMA calculation, with shorter time periods giving more weight to recent data and longer time periods giving more weight to historical data.
By incorporating recent price data more heavily, the EMA allows traders to quickly identify changes in market sentiment and adjust their strategies accordingly. This makes it particularly useful in fast-moving markets where prices can change rapidly.
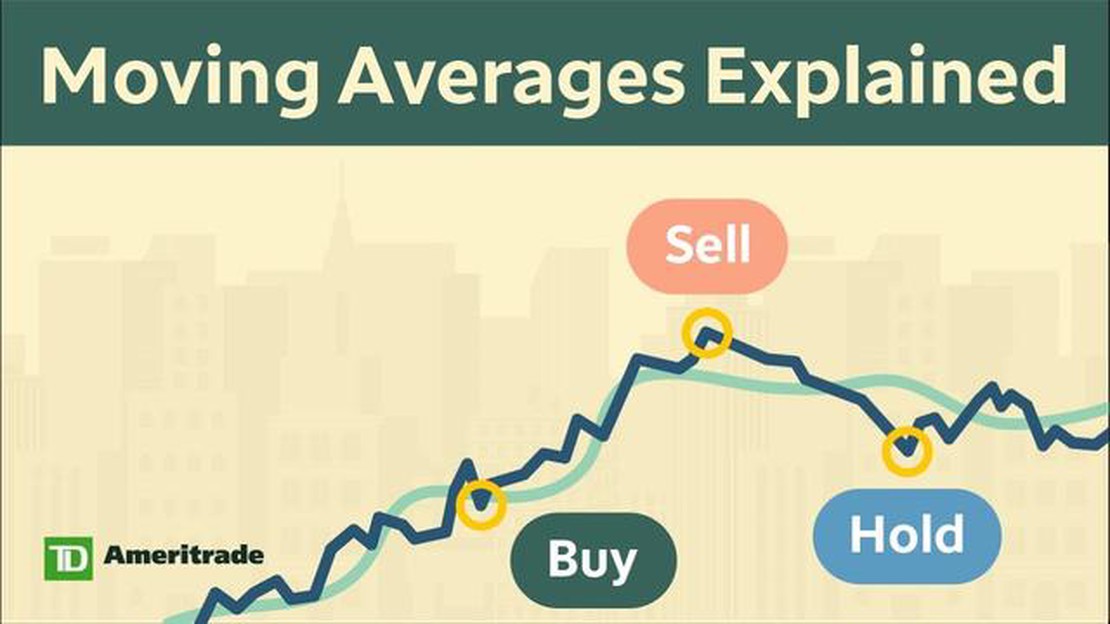
The EMA can be used in various ways in technical analysis. One common approach is to look for crossovers between the EMA and the price line, with the EMA acting as a support or resistance level. For example, a bullish crossover, where the price line moves above the EMA, may indicate a buy signal, while a bearish crossover, where the price line moves below the EMA, may indicate a sell signal.

Another way to use the EMA is to look for divergences between the EMA and the price action. For example, if the price is making higher highs but the EMA is making lower highs, it may indicate a potential reversal in the trend.
Overall, the EMA formula is a valuable tool in technical analysis that can help traders identify trends, confirm signals, and make better-informed trading decisions. However, like any indicator, it is not foolproof and should be used in conjunction with other technical analysis tools and market information.
The Exponential Moving Average (EMA) is a commonly used technical indicator that helps traders analyze the price trends of financial instruments. It is a type of moving average that places more weight on recent price data, making it more responsive to changes in the market compared to other moving averages.
Read Also: Understanding Forex Royal: Key Features and Benefits
The EMA formula calculates the average of a series of prices over a specified period of time, giving more weight to the most recent prices. This makes it ideal for traders who want to focus on the current market conditions and react quickly to price changes.
To calculate the EMA, you will need the following information:
Here is the EMA formula:
EMA = (Closing Price - EMA(previous period)) * Multiplier + EMA(previous period)
The multiplier is calculated using the following formula:
Multiplier = 2 / (Length of EMA + 1)
Read Also: Understanding SEC Employee Stock Options: A Complete Guide
Let’s walk through an example to illustrate how the EMA formula works. Suppose you want to calculate the 10-day EMA for a stock.
Understanding the EMA formula is key to using this technical indicator effectively in your trading strategy. By focusing on recent price data and reacting quickly to market changes, you can make more informed decisions and potentially increase your trading profits.
The Exponential Moving Average (EMA) formula is a commonly used tool in technical analysis that offers several significant benefits to traders and investors. Below are some of the key advantages of using the EMA formula:

In conclusion, the EMA formula offers numerous benefits to traders and investors. Its smoothing effect, faster responsiveness, trend identification capabilities, support and resistance level identification, and versatility make it an essential tool in technical analysis.
The EMA formula, or Exponential Moving Average formula, is a calculation used in technical analysis to determine the average price of a security over a specific time period. It gives more weight to recent prices, making it more responsive to short-term price movements.
The EMA formula differs from the Simple Moving Average (SMA) formula in that it gives more weight to recent prices. While the SMA gives equal weight to each data point, the EMA weighs recent prices more heavily, allowing it to react faster to price changes.
While there are no secrets per se, the EMA formula can provide valuable insights into a security’s price trend. By giving more weight to recent prices, it can help identify and confirm trends earlier than other moving averages. Traders often use the EMA in conjunction with other technical indicators to make more informed trading decisions.
The EMA formula can be used in trading as a tool to identify and confirm trends, as well as to generate buy or sell signals. For example, when the price of a security crosses above its EMA, it may be a signal to buy, while a cross below the EMA may be a signal to sell. Traders often use different periods of EMA to suit their trading strategy and time frame.
While the EMA formula can be a valuable tool, it is not without its drawbacks. One potential drawback is the whipsaw effect, where the EMA generates false signals during periods of high volatility or choppy price action. Additionally, the EMA can be sensitive to outliers or extreme price movements, which may affect its accuracy in certain market conditions.
The EMA (Exponential Moving Average) formula is a commonly used calculation that gives more weight to the most recent data points in a data set. It is used in technical analysis to smooth out price data and identify trends more effectively.
The EMA formula is considered to unlock the secrets of technical analysis because it provides more weight to recent data points, allowing traders to capture changes in price trends more quickly. This can be extremely beneficial for identifying entry and exit points in the market and making more accurate trading decisions.

Exchange Rate Policy in Azerbaijan: Is it Fixed? Azerbaijan, a country located at the crossroads of Eastern Europe and Western Asia, has a currency …
Read Article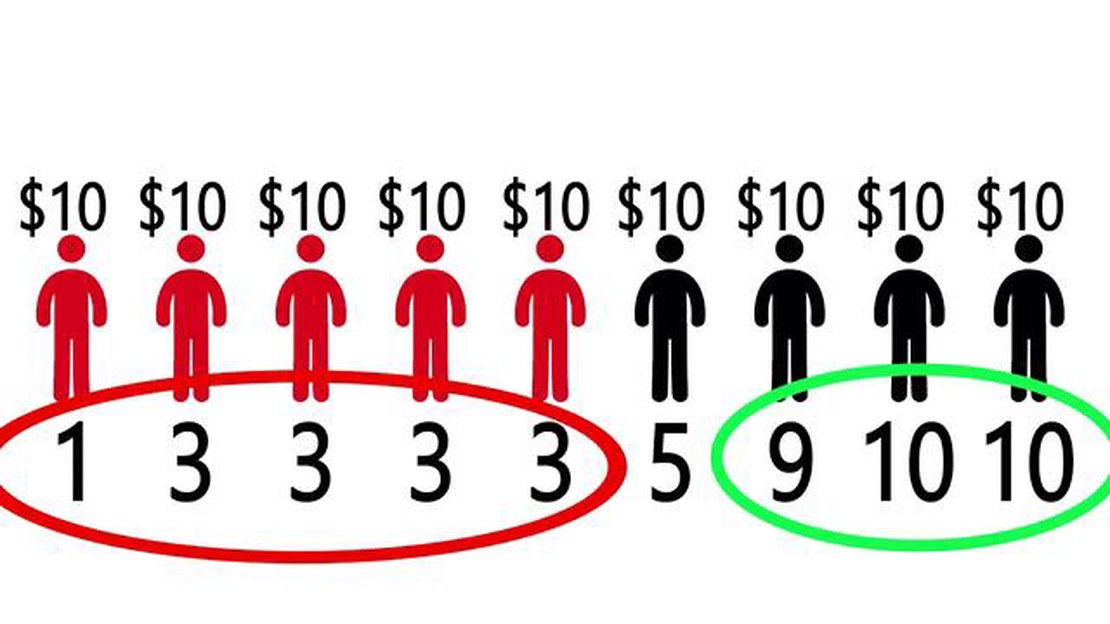
Advantages and Disadvantages of the Average of Averages The concept of using the average of averages is a common practice in statistical analysis, but …
Read Article
What is a put and call option strategy? A put and call option selling strategy is a financial strategy that involves the selling or writing of put and …
Read Article
Does Nadex have demo account? If you are new to trading or just want to test out your strategies in a risk-free environment, you may be wondering if …
Read Article
Which options newsletter is the best? Are you looking to take your investment strategy to the next level? Look no further than the top options …
Read Article
Is a long straddle strategy profitable? Option trading strategies can be a complex topic to navigate, but one strategy that often gets attention is …
Read Article


