

Beginner's Guide: How to Start Forex Trading in Malaysia
Step-by-Step Guide on How to Start Forex Trading in Malaysia If you are a beginner looking to start forex trading in Malaysia, you’ve come to the …
Read Article
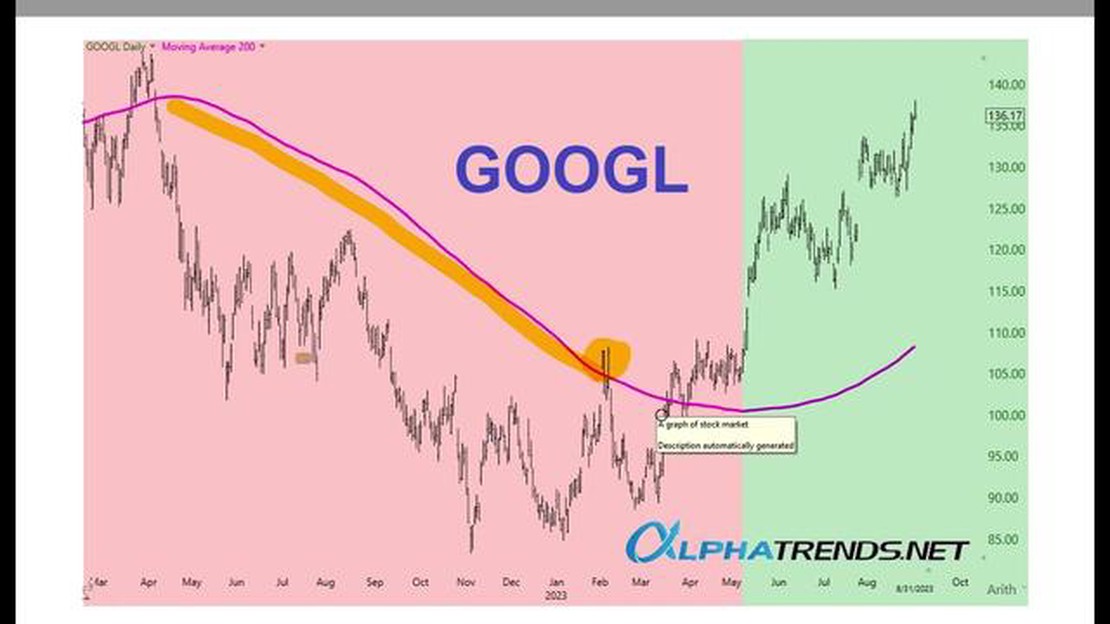
The 200-day Exponential Moving Average (EMA) is a powerful technical indicator that can assist traders in identifying trends and making informed decisions. It is widely used by both novice and experienced traders due to its simplicity and effectiveness.
The EMA is a type of moving average that places more weight on the most recent data points, making it more responsive to current market conditions. The 200-day EMA specifically focuses on a longer-term trend, providing traders with a clear picture of the market’s overall direction.
Setting up your 200-day EMA is a straightforward process that can be done on most trading platforms. First, you need to select the appropriate timeframe for your analysis, whether it’s a daily, weekly, or monthly chart. Then, locate the indicator tab on your platform and select the EMA option.
Once you’ve selected the EMA option, specify the time period as 200 days. This will ensure that the moving average is calculated based on the past 200 days of price data. You can also choose to customize the color and line thickness of the EMA line to suit your preferences.

By incorporating the 200-day EMA into your trading strategy, you can gain valuable insights into long-term market trends and potential entry and exit points. However, it’s important to remember that no indicator is infallible, and it should be used in conjunction with other technical analysis tools and risk management strategies.
An Exponential Moving Average (EMA) is a type of moving average that assigns more weight to the most recent data points, making it more responsive to recent price changes. It is a popular technical analysis tool used by traders and investors to identify trends and generate trading signals.
The EMA is calculated using a formula that takes into account the closing prices of a specified number of periods. The formula gives more weight to the recent prices by using a multiplier that is based on the number of periods specified. The multiplier for the most recent period is calculated using the formula: 2 / (N + 1), where N is the number of periods.
The EMA is calculated by taking the product of the closing price and the multiplier for each period, summing them up, and then dividing the result by the sum of the multipliers. This calculation gives more weight to the recent closing prices, and less weight to the older prices. The result is a moving average that is more responsive to recent price changes.
Read Also: What is a Good INR Rate? Understanding the Optimal Exchange Rate
The EMA is commonly used in conjunction with other technical analysis tools, such as support and resistance levels, to identify entry and exit points for trades. When the price crosses above the EMA, it is often seen as a bullish signal, indicating that the trend is upward. Conversely, when the price crosses below the EMA, it is often seen as a bearish signal, indicating that the trend is downward.
It is important to note that the EMA is not a standalone indicator and should be used in combination with other tools and indicators to make well-informed trading decisions. It is also important to consider that the EMA is a lagging indicator, meaning that it is based on past price data and may not accurately predict future price movements.
In conclusion, the EMA is a valuable tool for traders and investors to identify trends and generate trading signals. Its responsiveness to recent price changes can help traders take advantage of short-term price movements. However, it is important to use the EMA in conjunction with other tools and indicators and to consider its limitations as a lagging indicator.
The Exponential Moving Average (EMA) is a type of moving average that places more weight on recent data points and less weight on older data points. Unlike the simple moving average (SMA), which calculates the average of a given number of data points over a specified period, the EMA gives more importance to recent prices, making it more responsive to changes in the market.
The EMA is calculated using a formula that gives more weight to the most recent prices. The formula takes into account a smoothing factor, typically represented by a percentage, that determines the weight placed on each data point. The higher the smoothing factor, the more weight is given to recent prices, making the EMA more reactive to price changes.
The EMA is widely used by traders and analysts in technical analysis to help identify trends, determine buy and sell signals, and generate trading strategies. Its responsiveness to price changes makes it particularly useful for short-term trading or active trading strategies. By focusing on recent prices, the EMA can help traders capture more immediate market movements and react quickly to changing market conditions.
Read Also: What is an IV option? - An in-depth explanation and analysis
Furthermore, the EMA can be used as a useful tool for identifying support and resistance levels. When the price is above the EMA, it may suggest that the market is in an uptrend and the EMA can act as a support level. Conversely, when the price is below the EMA, it may indicate a downtrend and the EMA can serve as a resistance level.
Overall, the EMA is a popular and valuable technical indicator that can provide valuable insights into market trends and help traders make informed trading decisions. By incorporating the EMA into their analysis, traders can gain a deeper understanding of market dynamics and potentially improve their trading performance.
A 200-day Exponential Moving Average (EMA) is a technical indicator that helps to analyze the price trend of a security by smoothing out fluctuations and highlighting long-term trends.
A 200-day EMA is commonly used by traders and investors to identify long-term trends in the price of a security. It can provide a clearer picture of the overall direction of a security’s price movement compared to shorter-term moving averages.

To calculate a 200-day EMA, you need to first calculate the multiplier (2 ÷ (200 + 1)) and the initial EMA value (usually the closing price of the first data point). Then, for each subsequent data point, you can calculate the EMA using the formula: EMA = (closing price - EMA(previous day)) × multiplier + EMA(previous day).
The 200-day timeframe is significant because it represents the number of trading days in a year. It is widely used by traders and investors to assess the long-term trend and overall health of a security. A price consistently above the 200-day EMA is often seen as a bullish signal, while a price consistently below it can indicate a bearish trend.
Yes, a 200-day EMA can be used for various financial instruments such as stocks, commodities, or currencies. However, it is important to note that different instruments may have different levels of volatility and sensitivity to moving averages, so it is essential to adapt the EMA parameters accordingly.

Step-by-Step Guide on How to Start Forex Trading in Malaysia If you are a beginner looking to start forex trading in Malaysia, you’ve come to the …
Read Article
Benefits and Applications of the Monte Carlo Method When it comes to data analysis, accuracy and precision are of utmost importance. Researchers and …
Read Article
Who is the CEO of Jedora? Jedora is a leading technology company in the industry, known for its innovative products and services. The company has been …
Read Article
What is the moving average for a 5 minute time frame? When it comes to analyzing data in the financial markets, moving averages are a popular and …
Read Article
What is a Moderately Bearish Option Strategy? When it comes to investing in the stock market, there are a variety of strategies that traders can …
Read Article
How to Add Moving Average to Indicator in MT4 If you are a trader who uses MetaTrader 4 (MT4) for analyzing charts and making trading decisions, you …
Read Article


