


Why is Crude Oil Traded in USD? Explained
Why is crude oil traded in USD? Crude oil is the most heavily traded commodity in the world, with billions of dollars worth of oil changing hands …
Read Article

When it comes to analyzing data in the financial markets, moving averages are a popular and powerful tool. They can provide valuable insights into price trends and help traders make informed decisions. In this article, we will explore how moving averages can be used specifically for a 5-minute time frame.
A moving average is a calculation that helps smooth out price data by creating a constantly updated average. It is calculated by adding up a certain number of prices over a specific period and then dividing the sum by that period. The resulting value is then plotted on a chart to create a line that moves along with the prices.
For a 5-minute time frame, traders typically use moving averages to identify short-term trends and potential entry and exit points. By plotting a 5-minute moving average on a chart, traders can quickly visualize the direction in which prices are moving. If the moving average is sloping upward, it suggests that prices are generally increasing. Conversely, if the moving average is sloping downward, it indicates that prices are generally decreasing.
In addition to identifying trends, moving averages can also help traders identify support and resistance levels. If the price of an asset approaches a moving average from below and bounces off it, the moving average can act as a support level. On the other hand, if the price approaches a moving average from above and then reverses, it can act as a resistance level.
In summary, moving averages are a useful tool for analyzing price data on a 5-minute time frame. They can help traders identify trends, potential entry and exit points, as well as support and resistance levels. By understanding how to interpret moving averages, traders can gain a better understanding of market dynamics and make more informed trading decisions.
Moving averages are widely used technical indicators in financial markets. They are used to analyze price trends and help traders make informed decisions about when to enter or exit trades. A moving average is simply an average of a specific number of data points over a given time period, which is constantly recalculated as new data becomes available.
The calculation of a moving average involves adding up the values of a set number of data points and dividing the sum by the number of points. The resulting average is then plotted on a chart, creating a line that helps smooth out the fluctuations in price. This line provides a clearer picture of the overall trend.
There are different types of moving averages, such as simple moving averages (SMA) and exponential moving averages (EMA). The most commonly used moving averages are based on closing prices, but they can also be calculated using other data points such as high, low, or average prices.

Moving averages can be used in various ways. One common technique is to look for crossovers, where a shorter-term moving average crosses above or below a longer-term moving average. This can indicate a change in trend and is often used as a signal for buying or selling.
Another approach is to observe the relationship between price and the moving average, such as when the price is consistently above or below the moving average. This can be used to identify overbought or oversold conditions and potential reversal points.
Overall, moving averages are versatile tools that can assist traders in analyzing price trends and making better trading decisions. They can be used in conjunction with other technical indicators to confirm signals and improve the accuracy of trading strategies.
Read Also: Understanding Portfolio Overwriting: Definition, Risks, and Strategies
When it comes to trading, moving averages are an essential tool that traders use to analyze and predict price trends. They are widely regarded as one of the most reliable and effective indicators in technical analysis.
One of the primary advantages of using moving averages is that they help to smoothen out the price data, making it easier for traders to identify trends. By calculating the average price over a specific period, moving averages provide a clearer picture of whether the market is bullish or bearish.
Another crucial aspect of moving averages is that they can act as support and resistance levels. When the price crosses above a moving average, it often indicates a bullish trend and may suggest a buying opportunity. Conversely, when the price crosses below a moving average, it signals a bearish trend and may suggest a selling opportunity.
Moving averages also help traders to identify potential entry and exit points. For example, the crossover of two moving averages, such as the 50-day and 200-day moving averages, can generate a buy or sell signal. These crossovers are known as moving average crossover strategies and are widely used by traders.
Read Also: Understanding the TSXV: What Does TSXV Mean in Stocks and How Does It Work? | [Сайт]
Additionally, moving averages can help traders to filter out market noise and false signals. By analyzing the long-term trend using a longer period moving average, and confirming it with a shorter period moving average, traders can increase the accuracy of their trading decisions.
Lastly, moving averages can provide valuable information about the strength and momentum of a trend. For example, if the price is consistently trading above a rising moving average, it indicates a strong bullish trend. On the other hand, if the price is consistently trading below a declining moving average, it suggests a strong bearish trend.
In conclusion, moving averages play a crucial role in trading by helping traders identify trends, act as support and resistance levels, determine entry and exit points, filter out market noise, and assess trend strength and momentum. By understanding and effectively utilizing moving averages, traders can improve their trading strategies and increase their chances of success in the market.

A moving average is a calculation that helps smooth out price data over a specific period of time. It is commonly used in technical analysis to identify trends and potential price reversals.
A moving average is calculated by adding together a set of price data points over a specific period of time and dividing the sum by the number of data points. This gives you the average price over that period.
A 5 minute time frame is commonly used in trading because it provides more detailed information about price movements compared to longer time frames. It allows traders to analyze and react to price changes in a more timely manner.
Using moving averages on a 5 minute time frame allows traders to identify short-term trends and potential support and resistance levels. It helps traders make more informed decisions about when to enter or exit trades.
Yes, moving averages can be used on longer time frames as well. They are versatile tools that can be applied to different time frames depending on the trader’s strategy and objectives.
Moving averages are a statistical calculation used to analyze data over a certain period of time. They provide a smoothed line on a chart that helps identify trends and potential support or resistance levels.
For a 5-minute time frame, moving averages are calculated by summing up the closing prices of the last 5 minutes and then dividing the result by 5. This process is repeated for each subsequent 5-minute interval.

Why is crude oil traded in USD? Crude oil is the most heavily traded commodity in the world, with billions of dollars worth of oil changing hands …
Read Article
Understanding Why Your Equity is Greater Than Your Balance Have you ever noticed a discrepancy between your equity and balance in your financial …
Read Article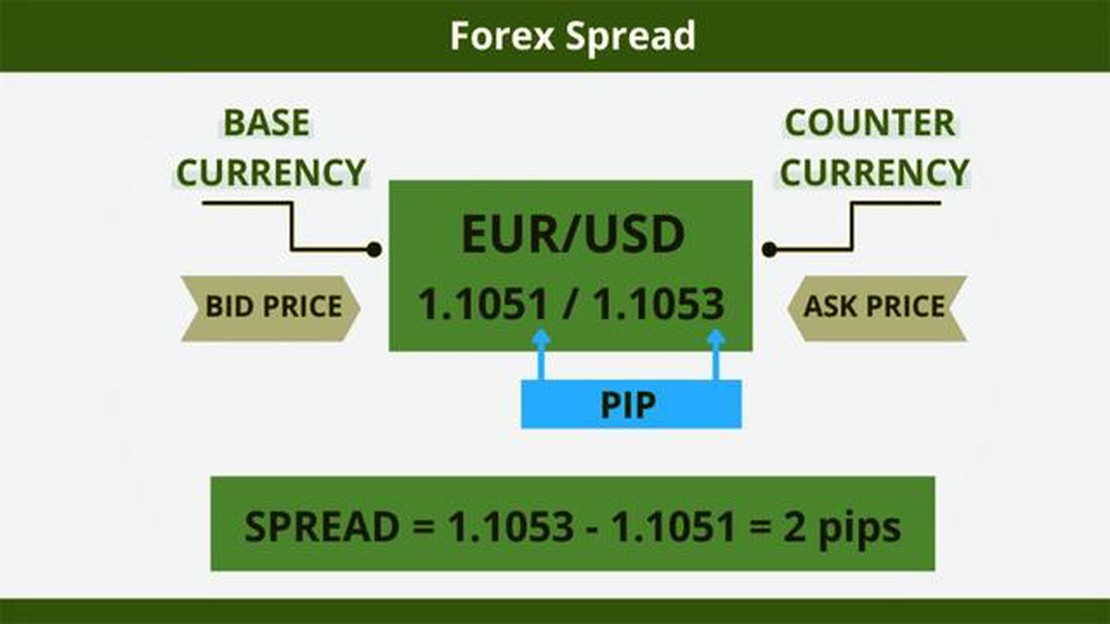
Calculating Spread Cost in Forex When it comes to trading in the foreign exchange market (Forex), it is important to understand the concept of spread …
Read Article
OFX Trustworthiness: A Comprehensive Review When it comes to transferring money internationally, finding a trustworthy and reliable service is …
Read Article
Advantages of Using PVC Sheet for Wall Covering When it comes to wall applications, PVC sheets offer numerous benefits that make them the preferred …
Read Article
Understanding Basket Trading in Zerodha Are you interested in exploring advanced trading strategies? Look no further! This comprehensive guide will …
Read Article


