


Citibank Currency Exchange Rate: Everything You Need to Know
Discover Citibank Currency Exchange Rate When it comes to international banking and finance, staying up to date with currency exchange rates is …
Read Article
The Linearly Weighted Moving Average (LWMA) is a mathematical method used to calculate the moving average of a time series data. Unlike the Simple Moving Average (SMA), which gives equal weight to all data points, the LWMA assigns more weight to recent data points, making it more responsive to recent price changes. This weighted approach gives more importance to recent trends and can be particularly useful in analyzing financial market data, where timely analysis is crucial.
To calculate the LWMA, each data point is assigned a weight based on its position in the time series. The weight decreases linearly as we move further back in time, with the most recent data point receiving the highest weight. This weighting scheme allows the LWMA to better capture short-term trends and react quickly to changes in the underlying data.
The LWMA can be calculated using various methods, such as the Exponential Moving Average (EMA) and the Hull Moving Average (HMA). The EMA is a popular method that gives more weight to recent data points by using a smoothing factor. This factor determines the weight assigned to each data point and can be adjusted to reflect the analyst’s preferences or market conditions. The HMA, on the other hand, uses a combination of weighted moving averages to reduce lag and provide a smoother curve. This method is particularly useful for trend analysis and identifying market reversals.
The LWMA and its various calculation methods find widespread applications in technical analysis, algorithmic trading, and financial forecasting. Traders and analysts use LWMA-based indicators to identify trends, generate buy/sell signals, and manage risk. The responsiveness of the LWMA to recent price changes makes it an effective tool for short-term trading strategies. Additionally, the LWMA can be used in conjunction with other technical indicators, such as the Relative Strength Index (RSI) or Moving Average Convergence Divergence (MACD), to confirm signals or generate more robust trading strategies.
In conclusion, the LWMA is a flexible and powerful tool for analyzing time series data. Its weighted approach allows it to capture short-term trends and react quickly to changes in the underlying data. By using various calculation methods, such as the EMA or HMA, analysts can tailor the LWMA to their specific needs and generate more accurate forecasts. Whether used in technical analysis or algorithmic trading, the LWMA and its applications have become an essential component of modern financial analysis.
In the world of finance and investment, Moving Averages (MA) are widely used as a tool to analyze and predict trends in the market. One specific type of MA is Linear Weighted Moving Average (LWMA), which applies a weight to each data point based on its position in the time series. By assigning more significance to recent data points, LWMA provides a more accurate representation of the current market conditions.
Mathematically, LWMA is calculated by multiplying each data point by its corresponding weight, summing up these products, and dividing the sum by the total weight. The weights are determined by the number of periods used for the calculation, with the most recent period having the highest weight. This calculation results in a single value that represents the moving average of the data.
A key advantage of LWMA compared to other types of moving averages is its responsiveness to recent changes in the market. By assigning higher weights to recent data, LWMA adapts quickly to shifts in market trends and provides more accurate signals for buying or selling assets.

Traders and investors use LWMA in various ways, including trend identification, support and resistance level analysis, and signal generation. For trend identification, LWMA is often used as a reference line to determine the direction and strength of the trend. When the LWMA is rising, it indicates an uptrend, while a declining LWMA suggests a downtrend.
In addition, LWMA can be used to identify support and resistance levels. When the price of an asset approaches or crosses the LWMA from below, it can act as a support level. Conversely, when the price approaches or crosses the LWMA from above, it can act as a resistance level.
Read Also: Where to Find Options on iPad: A Comprehensive Guide
Furthermore, LWMA can generate trading signals when it crosses over or under other moving averages or when the price crosses above or below the LWMA. These crossovers can indicate potential buying or selling opportunities.
Overall, understanding LWMA and its definition is crucial for traders and investors who want to utilize moving averages in their technical analysis. By applying LWMA, they can gain insights into market trends, identify support and resistance levels, and generate trading signals to make informed investment decisions.
There are several different methods for calculating the Linearly Weighted Moving Average (LWMA). Each method has its own advantages and disadvantages, and the choice of which method to use depends on the specific requirements of the analysis or trading strategy.
LWMA = (N * P1 + (N - 1) * P2 + (N - 2) * P3 + … + 2 * PN-1 + 1 * PN) / (N * (N + 1) / 2)
LWMA = (E1 * P1 + E2 * P2 + E3 * P3 + … + EN * PN) / (E1 + E2 + E3 + … + EN)
LWMA = (T1 * P1 + T2 * P2 + T3 * P3 + … + TN * PN) / (T1 + T2 + T3 + … + TN)
Read Also: Top Forex Trading Opportunities Today - Expert Insights & Analysis
LWMA = (H1 * P1 + H2 * P2 + H3 * P3 + … + HN * PN) / (H1 + H2 + H3 + … + HN)
Each of these methods has its own trade-offs in terms of responsiveness to recent data points, noise reduction, and computational complexity. Traders and analysts should choose the method that best suits their specific needs and objectives.

LWMA stands for Linear Weighted Moving Average. It is a type of moving average where more weight is given to the most recent data points.
LWMA is calculated by multiplying each data point by a corresponding weight, with the weights decreasing linearly as the data points get older. The weighted data points are then summed up and divided by the sum of the weights.
One advantage of using LWMA is that it gives more weight to recent data, making it more responsive to changes in the market. It can also help in reducing the lag effect that is common with simple moving averages.
Yes, LWMA can be used in different markets such as stocks, forex, commodities, etc. It is a versatile technical analysis tool that can be applied to various types of data.
One limitation of using LWMA is that it can be more sensitive to outliers or sudden spikes in data. It may also produce more false signals in choppy or sideways markets.
LWMA stands for Linear Weighted Moving Average. It is a commonly used method for calculating moving averages in financial analysis.

Discover Citibank Currency Exchange Rate When it comes to international banking and finance, staying up to date with currency exchange rates is …
Read Article
Obtaining Foreign Currency with American Express If you are planning to travel abroad and need foreign currency, you might be wondering if American …
Read Article
Is Czech koruna still valid? The Czech koruna is the official currency of the Czech Republic. It has been in circulation since 1993, when the …
Read Article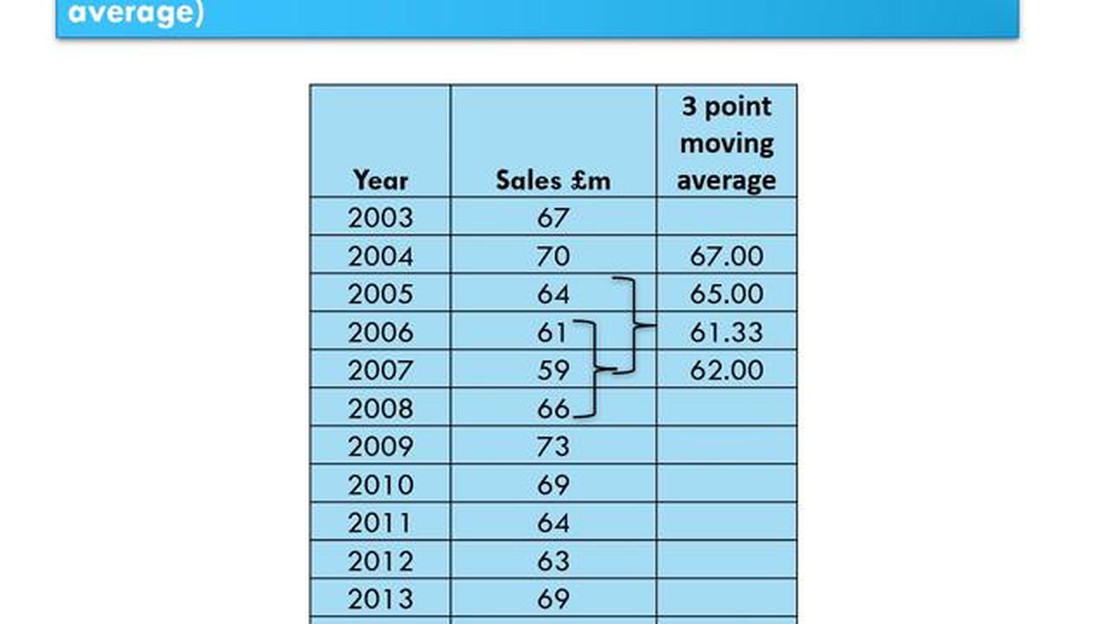
Understanding the 3 Period Moving Average If you’re new to trading or investing, understanding technical analysis can be overwhelming. One commonly …
Read Article
How Influencers Obtain Promo Codes As social media continues to shape our lives and influence our decisions, more and more brands are turning to …
Read Article
Do non-qualified stock options expire? Non-qualified stock options (NSOs) are a popular form of employee compensation that give employees the right to …
Read Article


