


Understanding Open API for FX Rates: A Comprehensive Guide
What is open API for FX rates? Foreign exchange rates are an essential part of the global financial system. They determine the value of one currency …
Read Article
When it comes to trading in today’s financial markets, having a solid strategy is essential. One popular strategy that traders often turn to is the MACD, or Moving Average Convergence Divergence, strategy. This powerful indicator can provide valuable insights into market trends and help traders identify potential entry and exit points.
In this comprehensive guide, we will delve into all aspects of the MACD based trading strategy. We will start by explaining the basics of the MACD indicator, including its calculation and interpretation. We will then explore various ways to use the MACD to identify trends, generate trading signals, and manage risk effectively.
Furthermore, we will discuss advanced techniques and tips for optimizing the MACD strategy. This will include exploring different timeframes, combining the MACD with other indicators, and adapting the strategy to various markets and trading styles. Whether you are a newbie trader or an experienced professional, this guide will equip you with the knowledge and tools needed to master the MACD based trading strategy.
“The MACD is a versatile and widely used trading tool, and understanding how to use it effectively can greatly enhance your trading performance. By the end of this guide, you will be equipped with a comprehensive understanding of the MACD strategy and be ready to apply it confidently in your trading.”
The Moving Average Convergence Divergence (MACD) is a popular technical analysis indicator used by traders to identify potential trends in the price of an asset. By understanding how the MACD works, traders can gain insight into the market and make more informed trading decisions.

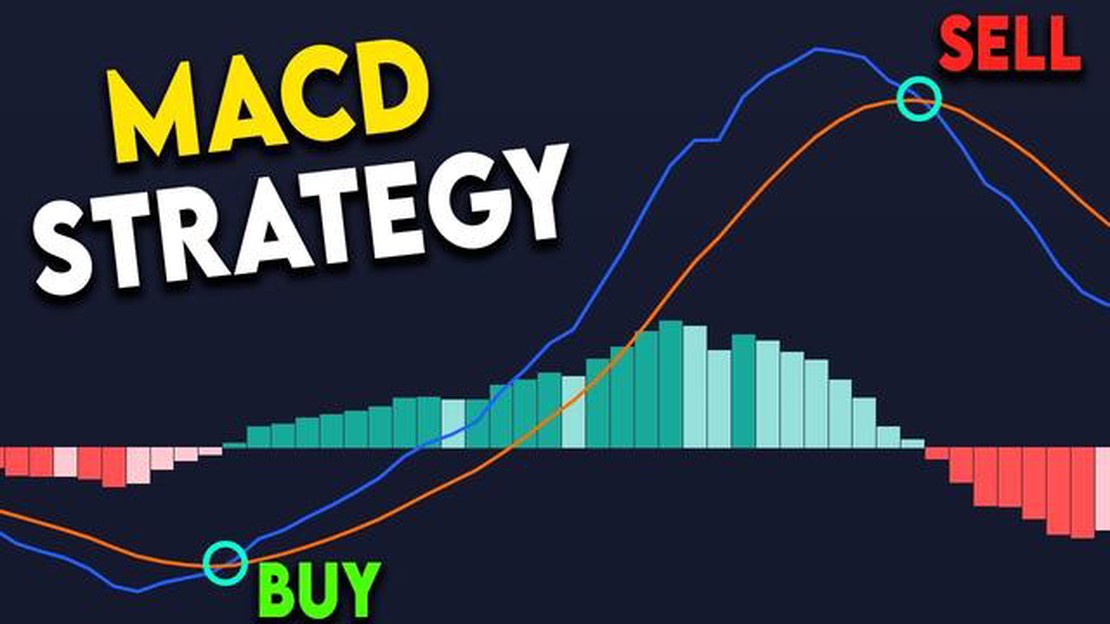
The MACD consists of two lines - the MACD line and the signal line - as well as a histogram. The MACD line is calculated by subtracting the 26-period exponential moving average (EMA) from the 12-period EMA. The signal line is a 9-period EMA of the MACD line. The histogram represents the difference between the MACD line and the signal line.
When analyzing the MACD, traders can use it to identify trends and determine when to enter or exit a trade. One of the main signals provided by the MACD is a crossover between the MACD line and the signal line. When the MACD line crosses above the signal line, it is considered a bullish signal, indicating that the price may increase. Conversely, when the MACD line crosses below the signal line, it is considered a bearish signal, indicating that the price may decrease.
In addition to crossovers, traders can also look at the relative position of the MACD line and the signal line to assess the strength of a trend. When the MACD line is above the signal line and both lines are above the zero line, it indicates a strong bullish trend. Conversely, when the MACD line is below the signal line and both lines are below the zero line, it indicates a strong bearish trend.
Traders can also use the MACD histogram to confirm trends. When the histogram bars are above the zero line, it indicates bullish momentum, while bars below the zero line indicate bearish momentum. Increasing histogram bars indicate strengthening momentum, while decreasing bars indicate weakening momentum.
In summary, understanding the basics of MACD and how it can be used to identify trends is essential for traders looking to implement a MACD-based trading strategy. By paying attention to crossovers, the relative positions of the MACD line and the signal line, and the histogram, traders can gain valuable insights and make more informed trading decisions.
Read Also: Discover the Best Trading Platform: Find the Perfect Name for Your Trading Needs
The Moving Average Convergence Divergence (MACD) indicator is a versatile tool that traders use to identify market trends. By analyzing the MACD line and signal line crossover, as well as the divergence between the MACD line and the price, traders can gain valuable insights into the market’s direction.
When the MACD line crosses above the signal line, it generates a bullish signal indicating that the market is trending upward. Traders can take this as an opportunity to enter a long position or to increase their existing long positions.
Read Also: Learn about Robert Kiyosaki's views on forex trading
Conversely, when the MACD line crosses below the signal line, it produces a bearish signal suggesting that the market is trending downward. In this case, traders may consider opening short positions or reducing their long positions.
In addition to the crossover signals, traders can also look for divergences between the MACD line and the price. A bullish divergence occurs when the price makes a lower low, but the MACD line makes a higher low. This indicates that the selling pressure is weakening and a potential reversal to the upside may be in store. Similarly, a bearish divergence occurs when the price makes a higher high, but the MACD line makes a lower high. This suggests that the buying pressure is diminishing and a potential reversal to the downside may occur.
By utilizing the MACD indicator, traders can effectively identify and react to market trends. However, it is important to note that the MACD is not infallible and should be used in conjunction with other technical analysis tools and risk management strategies.
In conclusion, the MACD indicator is a powerful tool for identifying market trends. Whether it’s through analyzing the crossovers between the MACD line and the signal line or the divergences between the MACD line and the price, traders can make informed trading decisions and stay ahead of market trends.
MACD stands for Moving Average Convergence Divergence. It is a popular technical indicator used in trading to identify potential trend reversals and generate buy or sell signals. The MACD is calculated by subtracting the 26-day exponential moving average (EMA) from the 12-day EMA, and a 9-day EMA is then plotted as a signal line. When the MACD line crosses above the signal line, it is considered a bullish signal, indicating a potential buying opportunity. Conversely, when the MACD line crosses below the signal line, it is a bearish signal, suggesting a potential selling opportunity.

Yes, the MACD can be used on any financial instrument, including stocks, commodities, forex, and cryptocurrencies. It is a versatile indicator that can help traders identify potential entry and exit points across different markets.
There are several common strategies that can be used with the MACD. One popular strategy is the MACD crossover, which involves buying when the MACD line crosses above the signal line and selling when it crosses below. Another strategy is the MACD divergence, which looks for divergences between the MACD and the price of the asset, indicating a potential trend reversal. Additionally, traders can use the MACD histogram to identify changes in momentum and make trading decisions based on its peaks and valleys.
While the MACD is a useful tool, it is important to be aware of its limitations. One limitation is that the MACD is a lagging indicator, meaning it may not provide immediate signals at the exact tops and bottoms of a trend. Traders should also be cautious of false signals, as the MACD can generate false buy or sell signals during periods of low volatility or when the price is in a ranging market. It is always recommended to use the MACD in conjunction with other indicators or analysis techniques to confirm signals and mitigate potential drawbacks.

What is open API for FX rates? Foreign exchange rates are an essential part of the global financial system. They determine the value of one currency …
Read Article
Creating a Custom Indicator in TradingView: A Step-by-Step Guide TradingView is a popular platform among traders and investors for its powerful …
Read Article
Can I drop items for my friends in Diablo 3? Diablo 3 is a popular action role-playing game that allows players to embark on epic quests and battle …
Read Article
Discover the Best EURUSD Scalping Strategy for Success When it comes to forex trading, the EURUSD currency pair is one of the most popular choices …
Read Article
Begin Online Trading in India: A Comprehensive Guide Online trading has gained popularity in India as more and more individuals are looking to make …
Read Article
Where can I drop off coins? Do you have a pile of loose change sitting around? Are you tired of lugging it to the bank or counting it out for hours? …
Read Article


