


Who can trade in F&: A Guide for Traders
Who can trade in F&? If you are interested in trading, it is important to know who can participate in the F& market. The F& market is open to both …
Read Article
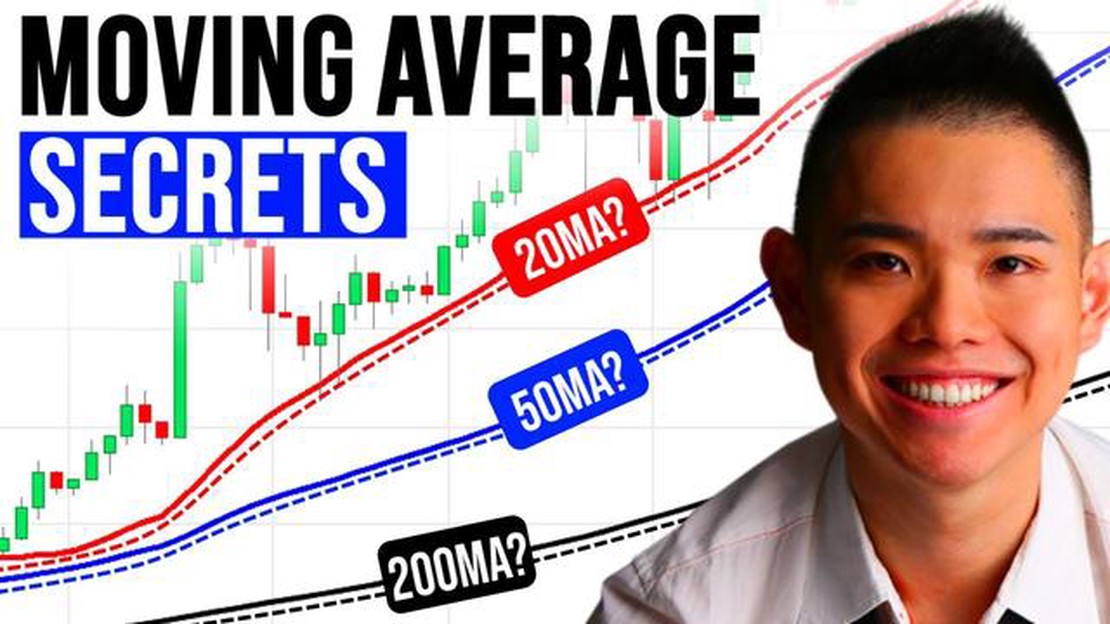
When it comes to technical analysis in trading, moving averages (MA) are a popular and effective tool. Moving averages help traders identify trends and potential entry or exit points in the market. Two commonly used moving averages are the MA 50 and MA 200, which represent the average price of a security over a specified period of time. Understanding how these moving averages work can be a valuable asset for any trader.
The MA 50, also known as the 50-day moving average, calculates the average price of a security over the past 50 trading days. This moving average is typically used by short-term traders to identify short-term trends in the market. If the price of a security is consistently above the MA 50, it indicates a bullish trend, suggesting that the security may continue to rise. Conversely, if the price is consistently below the MA 50, it indicates a bearish trend, suggesting that the security may continue to decline.
The MA 200, also known as the 200-day moving average, calculates the average price of a security over the past 200 trading days. This moving average is often used by long-term traders to identify long-term trends in the market. Similar to the MA 50, if the price of a security is consistently above the MA 200, it suggests a bullish trend, while consistently below the MA 200 suggests a bearish trend. The MA 200 is considered a significant level of support or resistance, as it represents the average price over a longer period of time and is closely watched by many traders.
Traders often pay close attention to the crossing of the MA 50 and MA 200. A bullish signal is triggered when the MA 50 crosses above the MA 200, also known as a golden cross, indicating a potential upward trend. On the other hand, a bearish signal is triggered when the MA 50 crosses below the MA 200, known as a death cross, indicating a potential downward trend. These crossovers can be useful in confirming trends and identifying potential buying or selling opportunities in the market.
Moving averages are widely used technical indicators in trading that help analyze price trends and identify potential buying or selling opportunities. They are calculated by taking the average value of a stock’s price over a specific period of time, and the resulting line is plotted on a chart to show how the price has been moving over that timeframe.

There are different types of moving averages, but the two most commonly used ones are the 50-day moving average (MA 50) and the 200-day moving average (MA 200). The MA 50 represents the average price of a stock over the past 50 trading days, while the MA 200 represents the average price over the past 200 trading days.
By looking at these moving averages, traders can get a sense of the overall trend in the stock’s price. If the current price is above the MA 50 or MA 200, it suggests that the stock is in an uptrend. On the other hand, if the price is below the MA 50 or MA 200, it indicates a downtrend.
Moving averages can also act as support and resistance levels. When the price approaches a moving average from below, it may find support and bounce off, indicating a potential buying opportunity. Conversely, when the price approaches a moving average from above, it may find resistance and reverse direction, indicating a potential selling opportunity.
It is important to note that moving averages are lagging indicators, meaning that they are based on historical data and may not accurately predict future price movements. However, they can still be a useful tool for traders to assess the overall market trend and make informed trading decisions.
| Advantages | Disadvantages |
|---|---|
| Easy to understand and interpret | Can lag behind actual price movements |
| Smooth out short-term price fluctuations | May generate false signals during volatile market conditions |
| Can be used in conjunction with other technical indicators | Not suitable for all types of markets |
Read Also: Discover Effective Ways to Find Forex Signals
In conclusion, moving averages play an important role in technical analysis and can provide valuable insights into price trends and potential trading opportunities. Traders should consider using these indicators in conjunction with other tools and strategies to make well-informed trading decisions.
Moving averages (MA) are a popular technical analysis tool used by traders to identify trends and potential entry or exit points in the market. A moving average is simply a calculation of the average price of a security over a specified period of time, which helps to smooth out fluctuations and highlight the overall direction of price movement.
There are different types of moving averages, but the most commonly used are the 50-day moving average (MA 50) and the 200-day moving average (MA 200). The MA 50 shows the average price over the past 50 trading days, while the MA 200 shows the average price over the past 200 trading days.
Traders use moving averages in various ways. One common strategy is to look for a crossover of the MA 50 and MA 200. When the MA 50 crosses above the MA 200, it is considered a bullish signal, indicating that the stock or market may be on an upward trend. Conversely, when the MA 50 crosses below the MA 200, it is considered a bearish signal, suggesting that the stock or market may be on a downward trend.
Read Also: Can You Actually Get Rich from Trading? The Truth Revealed
Moving averages can also be used to identify support and resistance levels. When the price of a security is above its MA, the MA may act as a support level, preventing the price from dropping further. On the other hand, when the price is below its MA, the MA may act as a resistance level, preventing the price from rising further.
In addition to crossovers and support/resistance levels, moving averages can also be used to determine the overall trend of a security. When the price is consistently above its MA, it suggests an uptrend, while a price consistently below its MA suggests a downtrend.
It’s important to note that moving averages are lagging indicators, meaning they are based on past prices and may not accurately predict future price movements. Therefore, it’s recommended to use moving averages in conjunction with other technical analysis tools and indicators to make more informed trading decisions.
MA 50 and MA 200 refer to the 50-day and 200-day moving averages, respectively, in trading. Moving averages are commonly used technical indicators that help traders analyze price trends and make informed trading decisions.
MA 50 and MA 200 are calculated by taking the average price over the specified time periods (50 days and 200 days, respectively). For each trading day, the closing price is added to the calculation, and then the sum is divided by the number of days in the time period to obtain the average.

MA 50 and MA 200 are considered important levels of support and resistance in trading. When the price is above the moving averages, it is often seen as a bullish signal, indicating a potential uptrend. Conversely, when the price is below the moving averages, it can be seen as a bearish signal, suggesting a potential downtrend.
While MA 50 and MA 200 are more commonly used by longer-term traders and investors, they can still be useful for day trading. Traders may pay attention to crossovers between the moving averages as potential buy or sell signals, or use the moving averages as reference points for setting stop-loss levels.
Yes, there are several other commonly used types of moving averages in trading. Some examples include the exponential moving average (EMA), weighted moving average (WMA), and smoothed moving average (SMMA). These moving averages may give different weights to more recent price data, resulting in different interpretations of price trends.
MA 50 and MA 200 are two commonly used moving averages in trading. MA 50 refers to the 50-day moving average, which is calculated by averaging the closing prices of a stock over the past 50 trading days. MA 200, on the other hand, refers to the 200-day moving average and is calculated by averaging the closing prices of a stock over the past 200 trading days. These moving averages are used to identify trends and support/resistance levels in the market.

Who can trade in F&? If you are interested in trading, it is important to know who can participate in the F& market. The F& market is open to both …
Read Article
Can you withdraw money from Expert Option? Expert Option is a popular online trading platform that allows users to trade various financial assets, …
Read Article
Calculating Lot Size in Options: A Comprehensive Guide Options trading can be a lucrative investment strategy, but understanding the lot size is …
Read Article
How Many Hours a Day Do Forex Traders Work? Forex trading is a lucrative venture that attracts traders from all over the world. With the potential for …
Read Article
Stock Market Trading Hours During Christmas As the holiday season approaches, many investors and traders are wondering when the stock market will be …
Read Article
What does a pending order mean? A pending order refers to an order that has been submitted by a customer but has not yet been processed or fulfilled …
Read Article


