

Can you mitigate systemic risk?
How to Navigate Systemic Risk and Minimize Its Impact Systemic risk refers to the potential collapse of an entire financial system or market, which …
Read Article
The Average Directional Index (ADX) is a popular technical indicator used by traders to measure the strength of a trend. Developed by J. Welles Wilder, it helps traders identify whether a market is trending or ranging. However, the ADX is most effective when combined with other indicators or analysis techniques.
One common pairing for the ADX is with moving averages. The ADX can be used in conjunction with moving averages to confirm a trend and filter out false signals. When the ADX is high and the moving averages are aligned in the direction of the trend, it signals a strong trend. Conversely, when the ADX is low and the moving averages are flat, it indicates a ranging market.
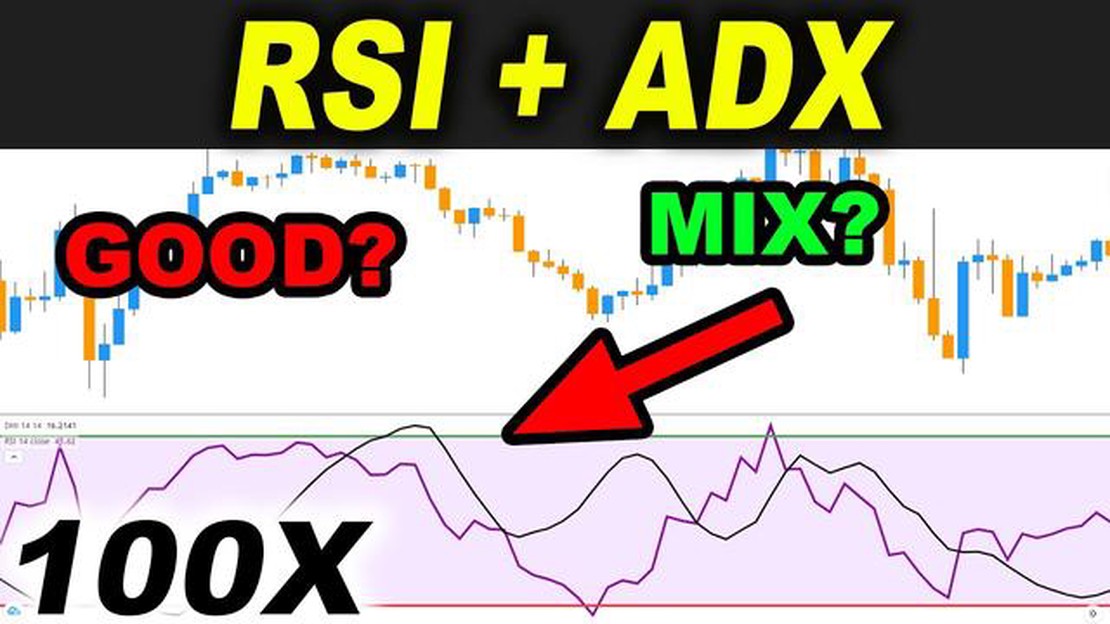
Another useful combination is the ADX with the Relative Strength Index (RSI). The RSI is a momentum oscillator that measures the speed and change of price movements. When the ADX and RSI are used together, traders can identify overbought and oversold conditions in a trending market. If the ADX is high and the RSI is above 70, it suggests that the market is overbought and a reversal may be imminent. If the ADX is low and the RSI is below 30, it suggests that the market is oversold and a reversal may occur.
Lastly, the ADX can be paired with trendline analysis. Trendlines are drawn on price charts to help identify the direction of the trend. When the ADX confirms the presence of a trendline breakout, it provides traders with confirmation of a strong trend. Additionally, the ADX can help traders determine the strength of the trendline breakout. If the ADX is high, it suggests a strong trendline breakout, whereas a low ADX indicates a weak breakout.
In conclusion, while the ADX is a powerful trend indicator on its own, it is most effective when combined with other indicators or analysis techniques. By combining the ADX with moving averages, RSI, or trendline analysis, traders can gain a clearer picture of the market and make more informed trading decisions.

When using the Average Directional Index (ADX) indicator, it can be helpful to combine it with other indicators to enhance your trading strategy. Here are some perfect pairings for the ADX indicator:
Remember that combining the ADX indicator with other indicators should be done with caution. It’s important to understand the signals and how they interact with each other before making any trading decisions.
The Average Directional Index (ADX) is a powerful technical indicator that can help traders identify strong trends in the market. However, using the ADX indicator alone may not provide enough information to make profitable trades. By combining the ADX indicator with other strategies, traders can enhance its effectiveness and increase their chances of success.
Read Also: Is PAYDAY 2 low spec? Discover the system requirements for this popular game
Here are some strategies that can be combined with the ADX indicator:
1. Moving Average Crossover: The moving average crossover strategy is a popular trend-following strategy. Traders can combine the ADX indicator with moving averages to confirm the strength of a trend. When the ADX line is rising and above a certain level (e.g., 25), a moving average crossover can be used as a signal to enter a trade in the direction of the trend.
2. Breakout Strategy: The ADX indicator can also be combined with a breakout strategy to identify potential trend reversals or continuation patterns. Traders can wait for the ADX line to rise above a certain level (e.g., 20) and then look for breakouts above resistance levels or below support levels as confirmation of a new trend.
3. Pullback Strategy: Traders can use the ADX indicator to identify pullbacks within a strong trend. When the ADX line is above a certain level (e.g., 30) and the price pulls back to a key support or resistance level, traders can look for signs of a reversal or continuation of the trend using other technical indicators or price action patterns.
Read Also: Software Used by National Stock Exchange for Efficient Trading
4. Divergence Strategy: Divergence occurs when the price and the ADX indicator are moving in opposite directions. Traders can use divergence as a signal of a potential trend reversal or weakening trend. For example, if the price makes a higher high while the ADX indicator makes a lower high, it could signal that the trend is losing momentum and a reversal may be imminent.
It’s important to remember that no strategy is foolproof, and combining the ADX indicator with other strategies does not guarantee success in trading. Traders should always practice proper risk management and conduct thorough analysis before making any trading decisions. The ADX indicator can serve as a valuable tool in a trader’s arsenal, but it should be used in conjunction with other indicators and strategies for optimal results.
By combining the ADX indicator with these strategies, traders can increase their chances of identifying strong trends and making profitable trades. Experimenting with different combinations and adjusting the parameters of the ADX indicator can help traders find the perfect pairing for their trading style and preferences.

ADX can be combined with other technical indicators such as moving averages, Bollinger Bands, and MACD. These indicators can provide additional insights into the strength of a trend and help traders make more informed decisions.
Yes, ADX can be used in combination with trendlines. By plotting trendlines on a price chart and using ADX as a confirmation tool, traders can identify potential trend reversals or continuation patterns.
Yes, ADX can be combined with Fibonacci retracements. Traders can use ADX to confirm potential support or resistance levels identified by the Fibonacci retracement tool, which can help in making more accurate trading decisions.
ADX can be combined with volume indicators like the On-Balance Volume (OBV) or the Chaikin Money Flow (CMF). By analyzing the relationship between ADX and volume, traders can gain insights into the strength of a trend and potential trend reversals.

How to Navigate Systemic Risk and Minimize Its Impact Systemic risk refers to the potential collapse of an entire financial system or market, which …
Read Article
What is the Other Purpose of Moving Averages in Time Series Analysis? When it comes to time series analysis, one of the most commonly used techniques …
Read Article
Understanding Capital Gains Tax on Forex in Canada Forex trading has become increasingly popular in Canada, with many individuals trying their hand at …
Read Article
How FPGA are Used in Trading Financial markets are fast-paced and highly competitive, where milliseconds can make all the difference. In this …
Read Article
What Makes TMX Stand Out: A Closer Look at TMX Features and Benefits TMX is a globally recognized leader in providing top-notch expertise and services …
Read Article
Is FBS a Legit Forex Broker? When it comes to choosing a forex broker, it is crucial to ensure that you are working with a legitimate and trustworthy …
Read Article


