
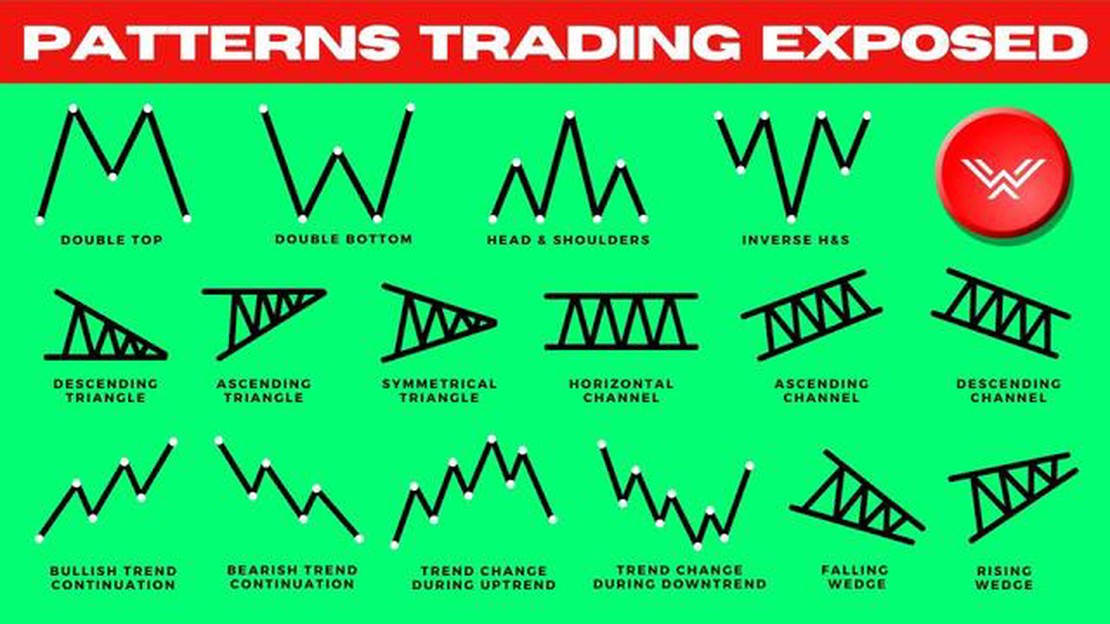

Learn how to master forex chart patterns for successful trading
Mastering Forex Chart Patterns: Expert Tips and Strategies When it comes to forex trading, understanding and analyzing chart patterns is crucial for …
Read Article
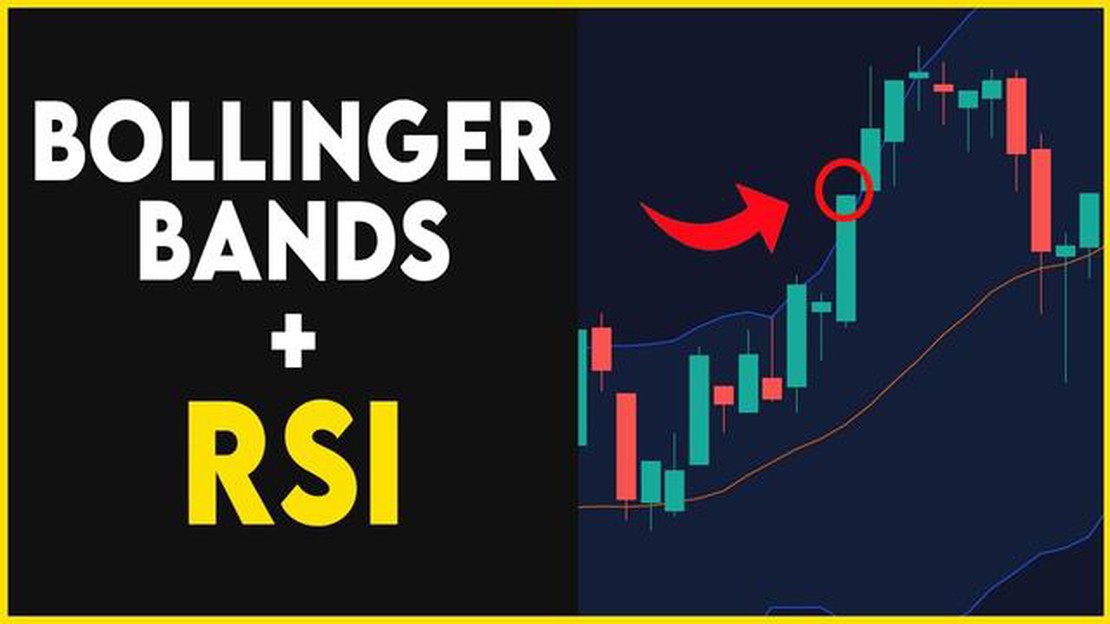
Bollinger Bands are a widely-used technical analysis tool that can help traders identify potential price reversals and gauge market volatility. Developed by John Bollinger in the 1980s, Bollinger Bands consist of a simple moving average line along with two bands that are plotted above and below the moving average.
The upper and lower bands act as dynamic support and resistance levels, expanding and contracting based on market volatility. When the price moves closer to the upper band, it indicates that the market is overbought, while a move towards the lower band suggests that the market is oversold. Traders can use these signals to enter or exit trades.
In addition to signaling overbought and oversold conditions, Bollinger Bands can also provide insights into the potential duration of a trend. When the bands contract, it suggests that the market is consolidating and a breakout may be imminent. Conversely, a widening of the bands indicates increased volatility and the potential for a strong trend.
By combining Bollinger Bands with other technical indicators, such as moving averages or stochastic oscillators, traders can create a comprehensive trading strategy. It is important to note that Bollinger Bands should not be used as the sole basis for making trading decisions, but rather as a tool to confirm signals from other indicators and to provide additional information about market conditions.
Bollinger Bands are a technical analysis tool created by John Bollinger in the 1980s. They consist of three lines that are plotted on a price chart and are used to measure volatility and identify potential trading opportunities.
The middle line in the Bollinger Bands is a simple moving average (SMA) of the price. The upper band is calculated by adding two standard deviations to the SMA, while the lower band is calculated by subtracting two standard deviations from the SMA. This creates a channel around the price that expands and contracts as volatility increases or decreases.

When the price is in the middle of the channel, it indicates that the market is relatively stable. When the price moves towards the upper band, it suggests that the market is overbought, and when it moves towards the lower band, it suggests that the market is oversold.
Bollinger Bands can also be used to identify potential breakouts. When the price moves outside of the channel, it may signal a trend reversal or the start of a new trend. Traders often look for confirmation from other indicators or chart patterns before placing trades based on Bollinger Bands.
It is important to note that Bollinger Bands are not a standalone trading system. They are a tool that can be used in conjunction with other technical analysis tools and indicators to make more informed trading decisions.
In conclusion, understanding the basics of Bollinger Bands is crucial for successful trading. By utilizing this technical analysis tool, traders can gain insights into market volatility, price levels, and potential breakout opportunities.
Read Also: Current THB to USD Exchange Rate: Find Out the Latest Conversion Rate
Bollinger Bands are a popular technical analysis tool that can be used to help identify potential entry and exit points in trading. They consist of a simple moving average with an upper band and a lower band that represents two standard deviations from the moving average. This creates a channel of price action that can be used to gauge market volatility and spot trends.
There are several ways to apply Bollinger Bands in trading strategies. Here are a few common approaches:
| Strategy | Description |
|---|---|
| Trend Reversal | When prices reach the upper or lower band, it may indicate an overbought or oversold condition, suggesting a potential trend reversal. Traders can look for bearish signals near the upper band and bullish signals near the lower band. |
| Breakout | When prices break out of the Bollinger Bands, it can signal a significant shift in market momentum. Traders can look for breakouts above the upper band as a potential signal to enter a long position, or breakouts below the lower band as a potential signal to enter a short position. |
| Volatility Squeeze | When the Bollinger Bands contract, it suggests decreasing market volatility. Traders can anticipate a potential increase in volatility and prepare for a breakout when the bands expand again. They can set buy or sell orders above or below the bands to capture potential price moves. |
| Mean Reversion | When prices deviate significantly from the moving average, it indicates an overextended move. Traders can enter positions opposite to the trend, betting that prices will revert back to the mean. This strategy requires careful risk management. |
It is important to note that Bollinger Bands are a tool that should be used in conjunction with other technical indicators and analysis methods. Traders should consider the overall market conditions, price patterns, and volume trends to validate signals generated by Bollinger Bands.
Read Also: Is MetaTrader 4 Free to Download? Find Out All About MT4 Here
By incorporating Bollinger Bands into trading strategies, traders can gain insights into potential price reversals, breakout opportunities, and market volatility, enhancing their decision-making process and potentially improving their trading outcomes.
Bollinger Bands are a technical analysis tool that consists of a middle band, an upper band, and a lower band. These bands are based on standard deviations and are used to measure volatility in the market.
Bollinger Bands can be used in various ways for trading. One common strategy is to buy when the price touches the lower band and sell when it touches the upper band. Traders can also look for patterns such as squeeze breakouts and reversals using Bollinger Bands.
When the price touches the upper band, it indicates that the market is overbought and there is a higher probability of a price reversal or a short-term pullback. Traders often take this as a signal to sell or take profits.

Yes, Bollinger Bands can be used for all types of markets, including stocks, forex, commodities, and cryptocurrencies. However, it is important to consider the specific characteristics of each market and adjust the parameters of the Bollinger Bands accordingly.
No, Bollinger Bands are often used in conjunction with other technical indicators and chart patterns to enhance trading decisions. Traders may combine Bollinger Bands with indicators such as moving averages, relative strength index (RSI), or MACD to confirm signals and increase their accuracy.
Bollinger Bands are a technical analysis tool created by John Bollinger. They consist of a simple moving average line and two bands that are plotted above and below the moving average. The upper band is calculated by adding a certain number of standard deviations to the moving average, while the lower band is calculated by subtracting a certain number of standard deviations from the moving average.
Bollinger Bands can be used to identify periods of high or low volatility in the market. When the price is moving within the bands, it is considered to be in a normal range. However, when the price moves above the upper band, it indicates that the market is overbought and a reversal to the downside is likely. On the other hand, when the price moves below the lower band, it indicates that the market is oversold and a reversal to the upside is likely.

Mastering Forex Chart Patterns: Expert Tips and Strategies When it comes to forex trading, understanding and analyzing chart patterns is crucial for …
Read Article
Understanding Forex in the Banking Industry Foreign exchange, or forex, plays a crucial role in the banking industry. It refers to the global market …
Read Article
Understanding the Mechanism of ICE Currency Exchange Foreign currency exchange is an essential part of international travel and business. When …
Read Article
Trading Currency Options: A Comprehensive Guide Currency options trading is a popular and widely used method for investors to speculate and profit …
Read Article
Is Group One Trading good? Group One Trading is a well-established trading firm that has garnered a reputation in the industry for its expertise and …
Read Article
Opening a Brokerage Account Abroad for US Citizens: Everything You Need to Know Many US citizens wonder whether they can open a brokerage account …
Read Article


