


Discover the Best Forex Scalping Signal for Maximum Profit
Discover the Best Forex Scalping Signal for Profitable Trading Forex scalping is a popular trading strategy that involves making quick trades with …
Read Article
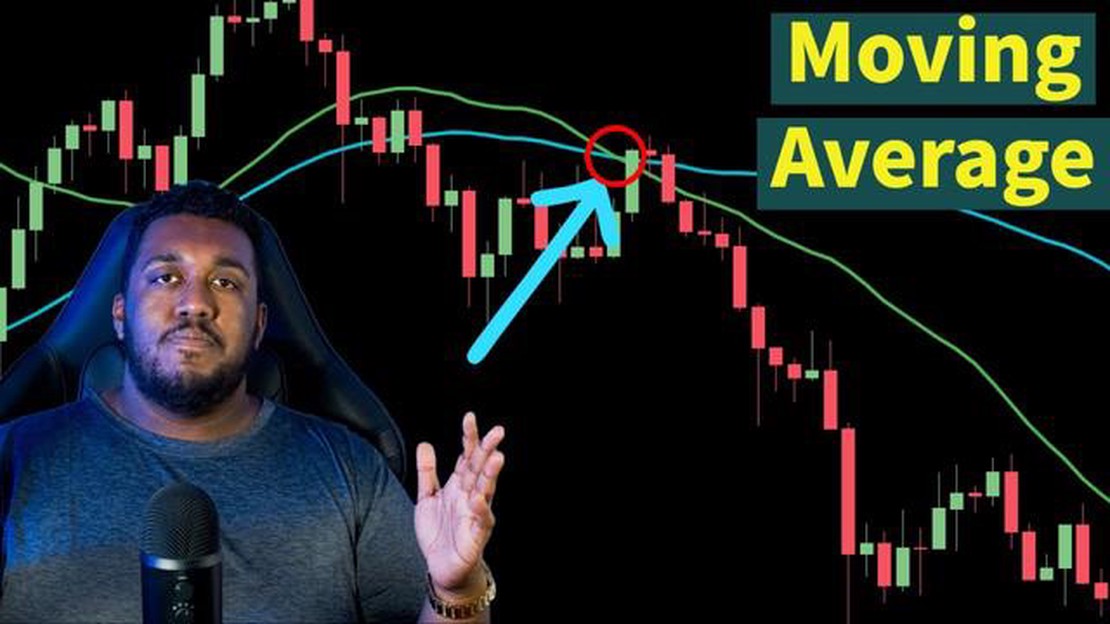
Data analysis plays a crucial role in understanding the trends and patterns hidden within raw data. One of the most commonly used techniques in data analysis is calculating the moving average. A moving average helps to smooth out the fluctuations in data and identify underlying trends by calculating the average of a specified number of data points over a given period of time.
Inserting a moving average in your data analysis allows you to gain insights into the overall direction of the data, filter out short-term fluctuations, and make more informed decisions. Whether you are analyzing stock prices, website traffic, or sales figures, understanding how to calculate and interpret a moving average can greatly enhance your analytical skills.
There are different types of moving averages, including simple moving averages (SMA), exponential moving averages (EMA), and weighted moving averages (WMA). Each type has its own advantages and limitations, and the choice depends on the specific requirements of your analysis. By utilizing the appropriate moving average technique, you can effectively highlight long-term trends while minimizing the impact of short-term noise.
To calculate a moving average, you need to determine the number of data points to include in the average and the time period over which the average should be calculated. For example, a 10-day moving average would calculate the average of the past 10 days’ worth of data. This moving average would then be updated as each new day’s data becomes available.
Understanding how to insert a moving average in your data analysis is a fundamental skill for anyone working with data. It allows you to uncover meaningful insights and make data-driven decisions based on the long-term trends rather than short-term fluctuations. By utilizing this technique, you can unlock the true potential of your data and gain a competitive edge in today’s data-driven world.
Moving averages are widely used in data analysis to identify trends and patterns. They are useful for smoothing out fluctuations in data and providing a clearer picture of the underlying patterns.
In simple terms, a moving average is the average of a specified number of data points from a given time period. It is called a moving average because it moves along the dataset as new data points are added and old data points are dropped.

There are different types of moving averages, but the most common one is the simple moving average (SMA). The SMA is calculated by taking the sum of a specified number of data points and dividing it by the number of data points.
For example, if you have a dataset of the closing prices of a stock for the past 10 days, you can calculate a 5-day SMA by adding up the closing prices of the last 5 days and dividing it by 5. This will give you the 5-day moving average.
Moving averages are often used to identify trends and potential reversal points in financial markets. Traders and analysts use moving averages to determine the direction of a trend and to generate buy or sell signals.
Read Also: Discover the Best Pivot Points in Tradingview for Successful Trading
There are also different ways to calculate moving averages, such as the weighted moving average (WMA) and the exponential moving average (EMA). These methods give more importance or weight to recent data points, allowing for faster reaction to current market conditions.
Overall, understanding the basics of moving averages is essential for any data analyst or trader. It is a fundamental tool for analyzing trends, smoothing out data, and making informed decisions based on historical price data.
In data analysis, moving averages are commonly used to smooth out fluctuations in data and identify trends over a specified period of time. It is a statistical technique that calculates the average of a subset of data points by continuously updating the average as new data points become available.
To calculate a moving average, you need to decide on a window size, which represents the number of data points you want to include in each average calculation. The larger the window size, the smoother the resulting moving average will be, but it might also mask important short-term fluctuations. Conversely, a smaller window size will capture more short-term fluctuations, but it might introduce more noise into your analysis.
Read Also: What is a Good Long Short Ratio? Expert Insights and Tips
Here are the steps to calculate a simple moving average:
Once you have calculated the moving averages, you can use them in your data analysis in several ways:
Overall, moving averages play a crucial role in data analysis by smoothing out data, identifying trends, and making predictions. They are a powerful tool that can help you gain insights from your data and make informed decisions.

A moving average is a statistical calculation used to analyze data points by creating a series of averages of different subsets of the full data set. It is commonly used to identify trends and patterns in time series data.
A moving average is calculated by taking the average of a subset of data points within a specified time period. This subset of data points “moves” along the data set, with each new average calculated as new data points are added and old data points are removed from the subset.
A moving average can smooth out fluctuations and noise in data, making it easier to identify underlying trends and patterns. It can also be used to make predictions and forecasts based on historical data.
Moving averages are commonly used in finance to analyze stock prices and identify trends. They can also be used in weather forecasting, sales forecasting, and in analyzing data from scientific experiments.
Some types of moving averages include the simple moving average (SMA), exponential moving average (EMA), weighted moving average (WMA), and triangular moving average (TMA). Each type of moving average has its own mathematical formula and properties.
A moving average is a statistical calculation used to analyze data points over a certain period of time by creating a series of averages. It helps to smooth out fluctuations and highlight underlying trends or patterns in the data.

Discover the Best Forex Scalping Signal for Profitable Trading Forex scalping is a popular trading strategy that involves making quick trades with …
Read Article
How much can I deposit without raising suspicion? When it comes to depositing money into your bank account, there are certain limits that you should …
Read Article
Understanding the Difference Between Long and Short Gamma In the world of finance, gamma refers to the measure of an option’s sensitivity to changes …
Read Article
Understanding the application of Fibonacci in forex trading Forex trading is a complex and challenging market where traders try to make profits by …
Read Article
Are Australian Cattle Dogs High Maintenance? Australian Cattle Dogs, also known as Blue Heelers or Queensland Heelers, are intelligent and energetic …
Read Article
Top In-Demand Jobs in Cyprus Cyprus, a vibrant Mediterranean island, is not only known for its stunning beaches and rich historical sites, but also …
Read Article


