
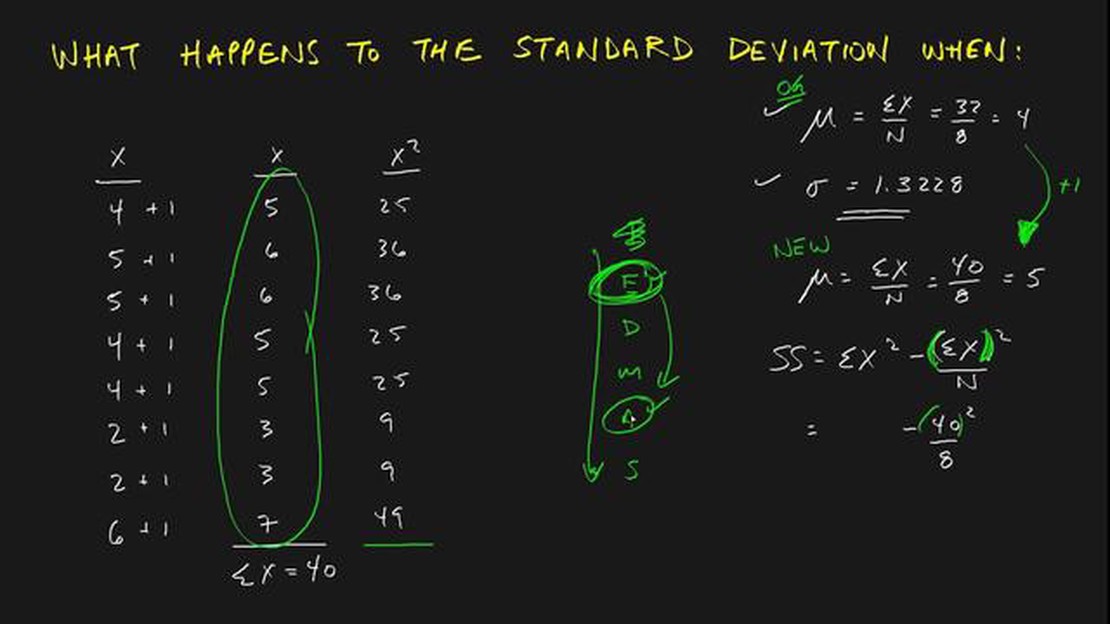

Understanding the Impact of Shifting Data on Standard Deviation
How does shifting data affect standard deviation? The standard deviation is a statistical measure that quantifies the amount of variability or …
Read Article
When planning a new database or trying to understand an existing one, creating an Entity-Relationship (ER) diagram can be a valuable tool. An ER diagram visually represents the entities, attributes, and relationships within a database.
To create an ER diagram, it is important to follow a step-by-step process. First, identify the entities involved in the database. Entities are the basic building blocks of a database and can be tangible or intangible things such as people, places, or concepts.
Next, determine the attributes of each entity. Attributes are characteristics or properties that describe the entities. For example, if the entity is “Customer,” the attributes may include the customer’s name, address, and phone number.
After identifying the entities and their attributes, it’s time to establish the relationships between them. Relationships define how the entities interact with each other. For example, a “Customer” entity may have a relationship with an “Order” entity, indicating that a customer can place multiple orders.
Once the entities and relationships are defined, it’s time to refine the ER diagram. This includes adjusting cardinality, which determines the number of instances of one entity that can be associated with an instance of another entity. Additionally, it may be necessary to include weak entities, which depend on a strong entity for their existence.
In conclusion, creating an ER diagram is an essential step in designing a database. By following a step-by-step process and carefully identifying entities, attributes, and relationships, you can create a clear and concise representation of your database structure.
An Entity-Relationship (ER) diagram is a visual representation of the structure of a database. It is composed of entities, which are objects or concepts that we want to store data about, and the relationships between these entities.

There are three main components of an ER diagram:
Each relationship can have a cardinality, which specifies the number of instances of one entity that can be related to the other entity. The cardinality can be one-to-one, one-to-many, or many-to-many.
By creating an ER diagram, you can visualize the structure of your database and understand how entities relate to each other. This understanding is essential for designing a well-organized and efficient database.
Read Also: When is the stock market closed for Christmas? | All you need to know
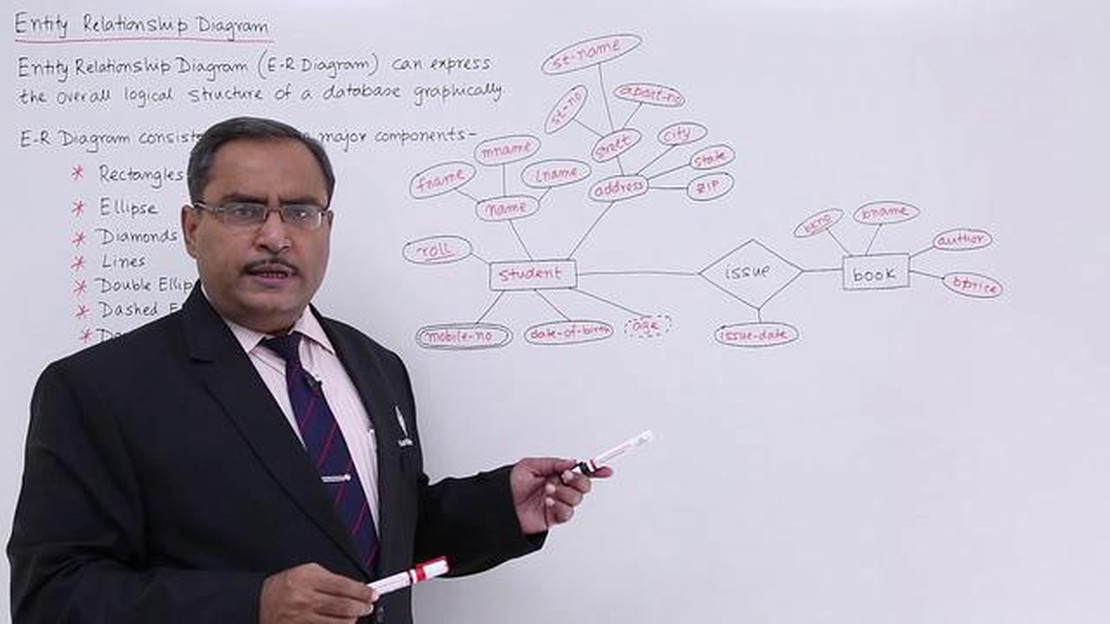
An Entity-Relationship (ER) Diagram is a visual representation of the structure of a database. It is used to show the relationships between different entities in the database. Entities are the objects or concepts that are important to the database, such as customers, products, or orders.
The ER diagram uses different symbols to represent entities, attributes, and relationships. Entities are represented by rectangles, attributes by ovals, and relationships by diamonds. Lines and arrows are used to indicate the relationships between entities.
The main purpose of an ER diagram is to provide a clear and concise way to understand the structure of a database. It helps to identify the entities in the database, their attributes, and the relationships between them. This information is crucial in designing and creating a database.
An ER diagram is often used as a starting point for creating a database schema. It serves as a visual guide that can help database designers and developers to understand the requirements of the database and create an efficient and well-organized database.
Once you have identified the purpose and scope of your database, the next step is to identify the entities and attributes that will be included. Entities represent the main objects or concepts in your database, while attributes describe the characteristics or properties of these entities.
Start by listing all the entities that are relevant to your database. For example, if you are creating a database for a bookstore, some possible entities could be “Book”, “Author”, “Customer”, and “Order”. Each entity should have a unique name that accurately reflects its purpose in the database.
Read Also: Can you day trade oil futures? Tips for successful day trading in oil futures
Next, consider the attributes associated with each entity. Attributes provide additional information about an entity and help to define its characteristics. For the “Book” entity, some possible attributes could be “Title”, “Author”, “Genre”, and “Price”. For the “Customer” entity, attributes could include “Name”, “Email”, “Phone Number”, and “Address”.
It is important to take the time to carefully identify and define the entities and attributes for your database. This step forms the foundation for organizing and structuring your data effectively. Consider the relationships between entities and the necessary attributes to accurately represent the real-world scenario that your database will model.
Once you have identified the entities and attributes for your database, you can move on to the next step of creating an ER diagram, which involves determining the relationships between entities and representing them graphically.

An ER diagram, or Entity-Relationship diagram, is a visual representation of the entities and their relationships in a database. It helps in understanding and designing the structure of a database, identifying entities, attributes, and relationships between them.
To create an ER diagram, you need to identify the entities in your database, define their attributes, and determine the relationships between them. Then, you can draw the diagram using symbols and connecting lines to represent these entities and relationships.
To identify entities, you need to consider the objects or concepts in your database that have unique attributes and can be distinguished from other objects. For example, in a school database, entities can be students, teachers, classes, and departments.
Attributes in an ER diagram represent the characteristics or properties of an entity. They describe the data that needs to be stored for each entity. For example, for a student entity, attributes can be name, age, gender, and student ID.
You can determine the relationships between entities by analyzing the interactions or associations between them. Relationships can be one-to-one, one-to-many, or many-to-many. For example, a student can have a one-to-many relationship with classes, as one student can be enrolled in multiple classes.

How does shifting data affect standard deviation? The standard deviation is a statistical measure that quantifies the amount of variability or …
Read Article
Which Forex broker to choose? Choosing the right forex broker is a crucial decision for anyone interested in trading currencies. With so many options …
Read Article
India’s Forex Reserves Decrease to $594.88 Billion: Expert Analysis India’s foreign exchange reserves have experienced a significant drop recently, …
Read Article
What Does GMT Stand for in Forex? Greenwich Mean Time (GMT) is a time reference used in the world of forex trading. GMT is a standard time that is …
Read Article
Using american express cards in Cape Town: What you need to know If you’re planning a trip to Cape Town and wondering whether or not to bring your …
Read Article
Does UPS offer stock options? Stock options are a popular form of employee compensation that many companies offer to attract and retain talented …
Read Article


