


Is IQ Option Halal in Islam? Explained in Detail
Is IQ Option Halal or Haram in Islam? When it comes to investing, many Muslims want to ensure that their financial activities are in line with the …
Read Article
Calculating moving averages can be a valuable tool for analyzing trends and predicting future values in Excel. Whether you’re tracking stock prices, sales data, or any other time series data, understanding how to calculate moving averages can help you make more informed decisions.
In this step-by-step guide, we will walk you through the process of calculating moving averages in Excel. We will start by explaining what moving averages are and why they are useful. Then, we will outline the different types of moving averages you can calculate, including simple moving averages and weighted moving averages.
We will then demonstrate how to calculate a simple moving average using Excel’s built-in functions. We will show you how to select the range of data, use the AVERAGE function, and adjust the period for the moving average calculation. Additionally, we will provide examples of how to calculate weighted moving averages using Excel’s SUMPRODUCT and SUM functions.
By the end of this guide, you will have the knowledge and skills to confidently calculate moving averages in Excel and use them to analyze and interpret your data. Whether you’re a beginner or an experienced Excel user, this guide will equip you with the tools you need to leverage moving averages in your data analysis.
A moving average is a statistical calculation used to analyze data over a certain period of time. It is widely used in finance, economics, and other fields to understand trends and patterns in data.
The moving average is calculated by taking the average of a set of data points over a specific period. This period, also known as the “window” or “lookback period”, can be any number of days, months, or other units of time, depending on the context of the data being analyzed.
By calculating the moving average, you can smooth out fluctuations in the data and identify underlying trends. It is particularly useful when analyzing data that exhibits high volatility or when trying to identify long-term trends in a noisy dataset.
The moving average can be calculated using different methods, such as simple moving average (SMA), exponential moving average (EMA), or weighted moving average (WMA). Each method has its own formula and characteristics, but the general idea is the same - to calculate the average of a set of data points over a specific period.
The moving average is often represented visually as a line on a chart, with the average value plotted for each period. This line can help identify trends, support and resistance levels, and potential reversals in the data.

In Excel, you can easily calculate the moving average using the built-in functions and formulas. It is a powerful tool for data analysis and can be applied to a wide range of datasets, from stock prices and sales figures to weather patterns and population trends.
| Advantages of Moving Average | Disadvantages of Moving Average |
|---|---|
| - Smoothes out fluctuations in data. | - Lagging indicator, reacts to historical data. |
| - Helps identify trends and patterns. | - May not be effective in rapidly changing markets. |
| - Easy to calculate and understand. | - May generate false signals in volatile markets. |
| - Can be applied to various types of data. | - May not capture short-term price variations. |
Overall, the moving average is a valuable tool for analyzing data and can provide insights into long-term trends and patterns. Whether you are a finance professional, economist, or data analyst, understanding how to calculate and interpret moving averages can enhance your analytical skills and decision-making abilities.
Calculating moving averages in Excel can be a useful tool for analyzing trends and making predictions. Here are some reasons why you might want to calculate moving averages in Excel:
Read Also: What is a stock offered to employees? Understanding employee stock ownership
Overall, calculating moving averages in Excel can be a valuable tool for data analysis and trend forecasting. Whether you are analyzing stock prices, sales data, or any other type of time series data, understanding how to calculate moving averages can provide valuable insights.
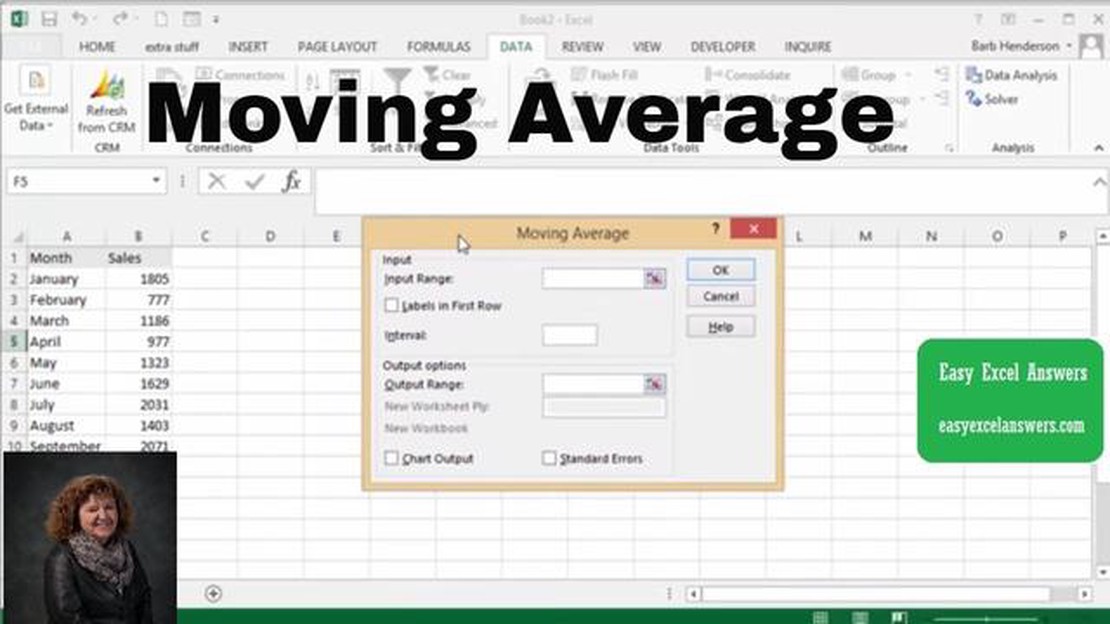
Moving averages are widely used in financial analysis to identify patterns, trends, and seasonality in data. In Excel, calculating moving averages is a relatively straightforward process. Here is a step-by-step guide to help you calculate moving averages in Excel:
Step 1: Open Excel and enter your data into a worksheet. Make sure the data is organized in columns and rows.
Step 2: Decide on the number of periods you want to include in your moving average calculation. This will depend on the nature of your data and the level of smoothing you require.
Step 3: Create a new column next to your data column. This column will contain the moving averages. Label the column as ‘Moving Average’ to keep track of your calculations.
Step 4: In the first cell of the moving average column, enter the following formula: “=AVERAGE(B2:B[periods+1])”. Replace ‘periods’ with the number of periods you decided in step 2. For example, if you want to calculate a 3-period moving average, the formula would be “=AVERAGE(B2:B4)”.
Read Also: How much is $100 in Nairobi Kenya? Convert and Calculate Currency Exchange Rates
Step 5: Once you enter the formula in the first cell, you can use the fill handle to apply the formula to the rest of the cells in the moving average column.
Step 6: Your moving average column should now display the moving averages for each period. Depending on the size of your data, you might need to adjust the formula in the first cell as you copy it to the rest of the cells to ensure that the correct range is included in the calculation.
Step 7: Format the moving average column to your desired formatting options such as number of decimal places or currency symbols.
Step 8: Analyze the moving averages to identify trends, patterns, and seasonality in your data. Moving averages can help you smooth out fluctuations and make it easier to interpret your data.

By following these steps, you should be able to calculate moving averages in Excel and leverage them for data analysis and forecasting purposes. Excel provides a powerful tool for analyzing data and applying moving averages can be a valuable technique for extracting insights.
Moving average is a statistical calculation that is used to analyze data over a certain period of time. It is used to smooth out fluctuations and identify trends in the data.
Calculating moving average can help you identify trends and patterns in your data. It can also help you make forecasts and predictions based on historical data.
To calculate moving average in Excel, you can use the AVERAGE function along with the OFFSET function. You can specify the range of cells for which you want to calculate the average, and the number of periods you want to include in the calculation.
No, moving average is typically calculated for numerical data. It involves averaging a set of numbers over a specific period of time.
Moving average can help you identify and understand trends in your data. It can also help you make predictions and forecasts based on historical data. It can be a useful tool for decision making and planning.
A moving average is a statistical calculation that is used to analyze data over a certain period of time. It helps to smooth out fluctuations and highlight trends in the data.

Is IQ Option Halal or Haram in Islam? When it comes to investing, many Muslims want to ensure that their financial activities are in line with the …
Read Article
How to Set Multiple Take-Profit Levels in Forex In forex trading, take profit levels play a crucial role in managing your trades and maximizing your …
Read Article
Is there a future for Citrix? Citrix Systems is a well-known software company that specializes in virtualization, networking, and cloud computing …
Read Article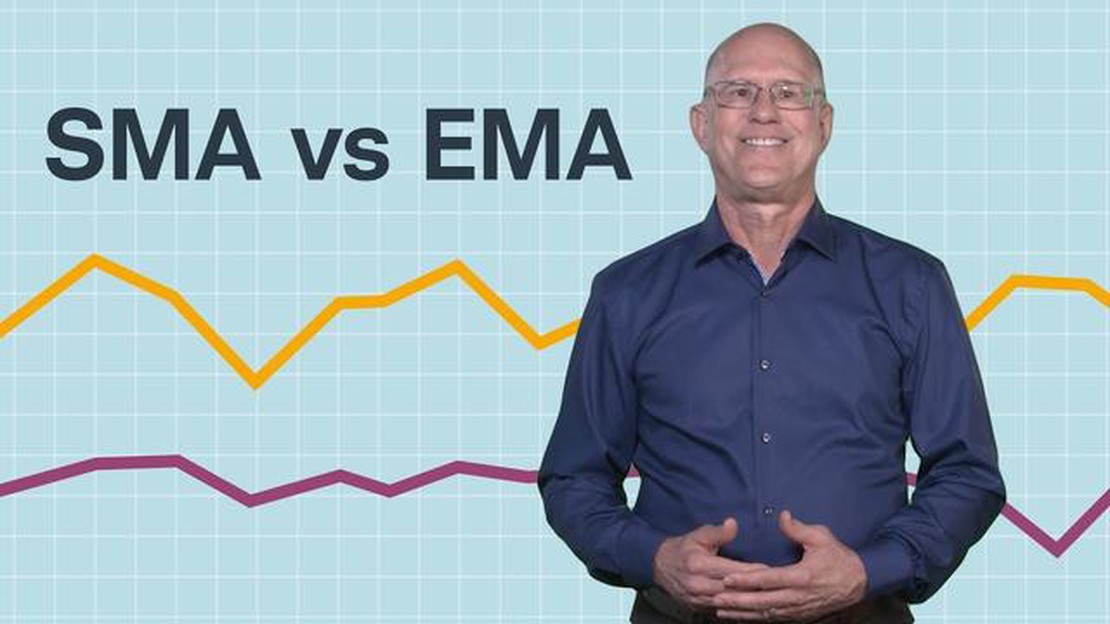
Comparing EMA and DMA: Which is the Superior Choice? If you’re into trading, you’ve probably come across the terms EMA and DMA. These are two popular …
Read Article
Risks of Credit Spread Options Credit spread options are a popular financial instrument that allow investors to speculate on the movement of credit …
Read Article
What is the difference between average cost and weighted average cost? When it comes to managing costs, businesses often rely on different techniques …
Read Article


