


Is it possible to make a living by trading forex? Expert insights revealed
Can You Make a Living Trading Forex? If you’ve ever wondered whether it’s possible to make a living by trading forex, you’re not alone. The foreign …
Read Article
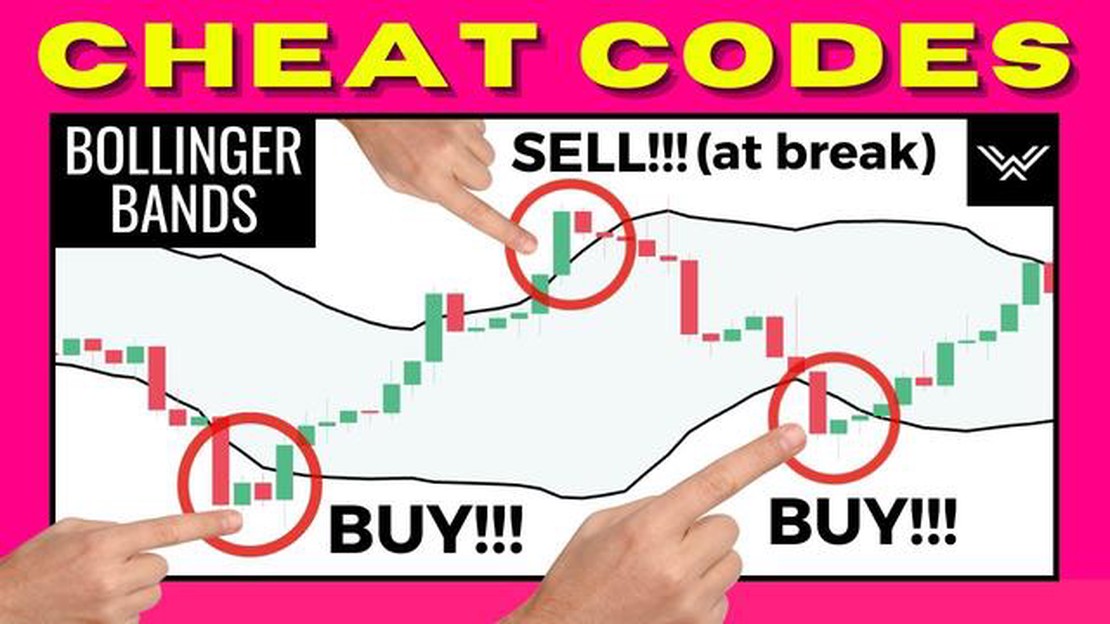
The Bollinger Band indicator is a popular technical analysis tool used by traders to help determine price volatility and potential market trends. Developed by John Bollinger in the 1980s, it consists of a simple moving average line, an upper band, and a lower band. These bands are based on standard deviations and are typically placed two standard deviations above and below the moving average line.
The Bollinger Band indicator is often praised for its ability to provide valuable information about market conditions. Traders use it to identify periods of low volatility, which can indicate the potential for a breakout, as well as periods of high volatility, which can indicate a reversal or trend continuation. The indicator is also used to identify overbought and oversold conditions, as price levels that touch the upper or lower band may be due for a reversal.
While the Bollinger Band indicator is widely used and respected in the trading community, it is important to note that no indicator is perfect. Like any other technical analysis tool, it has its limitations and should not be relied upon as a standalone signal for trading decisions. Traders should use the Bollinger Band indicator in conjunction with other indicators and analysis techniques to confirm potential trading opportunities.
It is also important to understand that the Bollinger Band indicator is not always accurate. Market conditions can change rapidly, and the indicator may not always provide accurate signals. Traders should take into consideration other factors, such as market fundamentals and news events, before making trading decisions based solely on the Bollinger Band indicator.
Overall, while the Bollinger Band indicator can be a useful tool in a trader’s arsenal, it is not infallible and should be used in conjunction with other indicators and analysis techniques. Traders should also exercise caution and use their own judgment when interpreting the signals provided by the indicator. By doing so, they can increase the precision and effectiveness of their trading strategies.
The Bollinger Band Indicator is a popular technical analysis tool used by traders to assess the volatility and potential price movements of a financial instrument. It consists of three lines, the upper band, the lower band, and the middle band, which is a simple moving average. The upper and lower bands are calculated based on the standard deviation of the underlying data, typically the closing prices of an asset.

While the Bollinger Band Indicator is widely used by traders, it is important to understand its limitations and consider other factors when making investment decisions. Like any technical analysis tool, it is not always accurate and should not be used in isolation.
One of the main drawbacks of the Bollinger Band Indicator is that it is a lagging indicator. This means that it can only provide information about past price movements and may not accurately predict future price movements. Traders should be cautious and consider other indicators or factors, such as fundamental analysis or market sentiment, when using the Bollinger Bands.
Another issue with the Bollinger Band Indicator is that it can give false signals, especially during periods of low volatility. When the market is ranging or consolidating, the bands may contract, and the price may move within a narrow range. In such cases, the Bollinger Bands may give conflicting or misleading signals, leading to potential losses if followed blindly.
However, despite its limitations, the Bollinger Band Indicator can still be a useful tool in a trader’s arsenal if used correctly. To increase its accuracy, traders can combine it with other indicators or use it in conjunction with other analysis techniques. It can provide helpful information about potential support and resistance levels and help identify overbought or oversold conditions.
In conclusion, the Bollinger Band Indicator is a widely used tool among traders, but its accuracy is not absolute. It should be used in conjunction with other indicators and analysis techniques, and traders should be aware of its limitations and potential false signals. Ultimately, successful trading requires a comprehensive approach that takes into account various factors, including market conditions, fundamental analysis, and risk management strategies.
Read Also: Stock Dividend Tax in Denmark: Understanding How Much You Need to Pay
The precision of the Bollinger Band indicator is a key factor in determining its effectiveness. When used correctly, the indicator can provide valuable insights into market trends and potential price reversals. However, it is important to understand its limitations and the potential for false signals.
One aspect of precision is the ability of the Bollinger Bands to accurately identify overbought and oversold conditions in the market. The upper band, which is calculated by adding the standard deviation of the price to the moving average, can act as a resistance level when the market is overbought. Similarly, the lower band can act as a support level when the market is oversold.
Read Also: Discover the Best Volume Indicator for Accurate Market Analysis
While these bands can be effective in identifying extreme market conditions, they are not foolproof. In volatile markets, prices can continue to move in one direction despite reaching the upper or lower band. Traders must be mindful of this possibility and use additional confirmation indicators to validate the signals provided by the Bollinger Bands.
Another aspect of precision is the ability to accurately identify price reversals. The Bollinger Bands can be useful in spotting potential reversals when the price touches or crosses the upper or lower band. This can signal a change in market sentiment and a potential shift in the direction of the price.
However, it is important to note that not all touches or crosses of the bands will result in a reversal. Traders must use additional analysis techniques to confirm the validity of these signals, such as examining candlestick patterns or using other trend indicators.
Overall, the precision of the Bollinger Band indicator depends on the skill and experience of the trader in interpreting its signals. It is important to use the indicator as part of a comprehensive trading strategy and not rely solely on its signals. By combining it with other indicators and analysis techniques, traders can improve the precision and effectiveness of the Bollinger Bands in their trading decisions.
The Bollinger Band indicator can be a useful tool for predicting market trends, but it is not foolproof. It provides valuable information about price volatility and potential reversal points, but it should be used in conjunction with other technical indicators and analysis methods for more accurate predictions.

Bollinger Bands help traders in making trading decisions by providing information about price volatility and potential reversal points. When the price moves close to the upper band, it indicates that the market is overbought and a price reversal may occur. On the other hand, when the price moves close to the lower band, it indicates that the market is oversold and a price reversal may occur. Traders can use this information to adjust their trading strategies accordingly.
Bollinger Bands are generally accurate in predicting market volatility. When the bands are wide, it indicates high volatility, and when the bands are narrow, it indicates low volatility. However, it is important to note that market conditions can change rapidly, and the accuracy of the Bollinger Bands in predicting volatility can vary depending on the specific market and timeframe being analyzed.
Bollinger Bands work well in most market conditions, but their effectiveness can vary depending on the specific market and timeframe being analyzed. In trending markets, Bollinger Bands can help identify potential reversal points. In range-bound markets, Bollinger Bands can help identify overbought and oversold levels. However, it is always recommended to use Bollinger Bands in conjunction with other technical indicators and analysis methods for more accurate predictions.
Bollinger Bands can be used as a standalone indicator, but it is generally recommended to use them in conjunction with other technical indicators and analysis methods for more accurate predictions. Bollinger Bands provide valuable information about price volatility and potential reversal points, but they do not take into account other factors such as market fundamentals or news events that can also impact price movements. Therefore, using Bollinger Bands as part of a comprehensive trading strategy is usually more effective.
The Bollinger Band indicator is a technical analysis tool that consists of a simple moving average (SMA) in the middle and two standard deviation channels above and below it. It is used to measure price volatility and identify potential overbought or oversold conditions in the market.

Can You Make a Living Trading Forex? If you’ve ever wondered whether it’s possible to make a living by trading forex, you’re not alone. The foreign …
Read Article
SWIFT Code for IBAN: Everything You Need to Know The SWIFT code for IBAN, or International Bank Account Number, is a crucial component of the global …
Read Article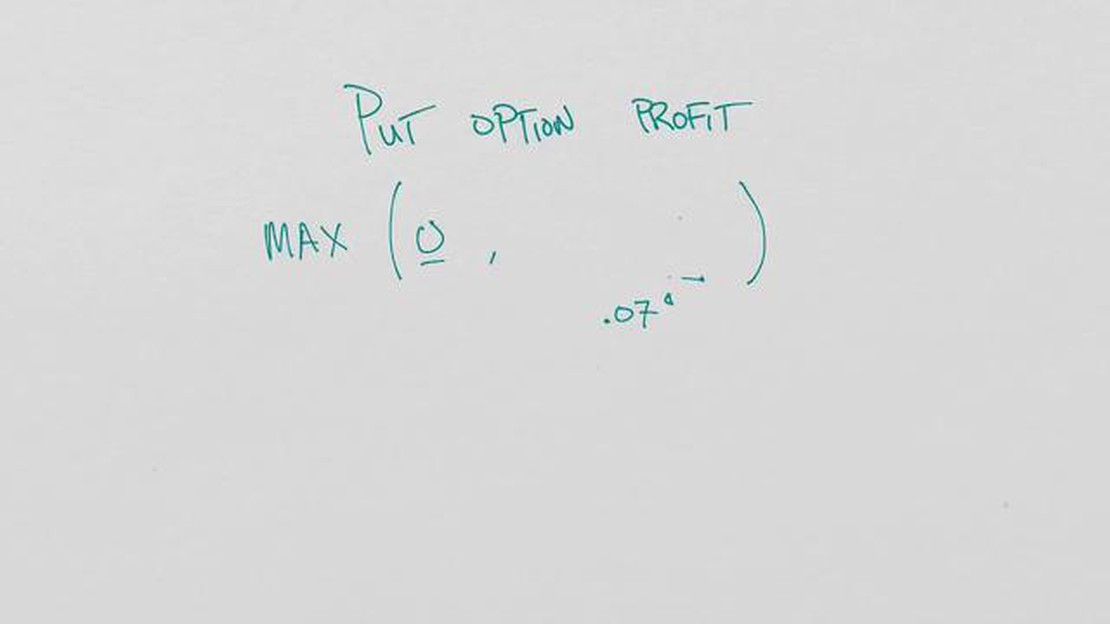
Example of a Currency Option Hedge Foreign exchange risk is a common concern for companies involved in international trade. Fluctuations in currency …
Read Article
How to Hedge Currency with Options When investing in foreign markets, the fluctuation of currency exchange rates can significantly impact the returns …
Read Article
Which is the best indicator for gold? When it comes to investing in gold, having the right indicator is crucial. Gold is a highly volatile commodity …
Read Article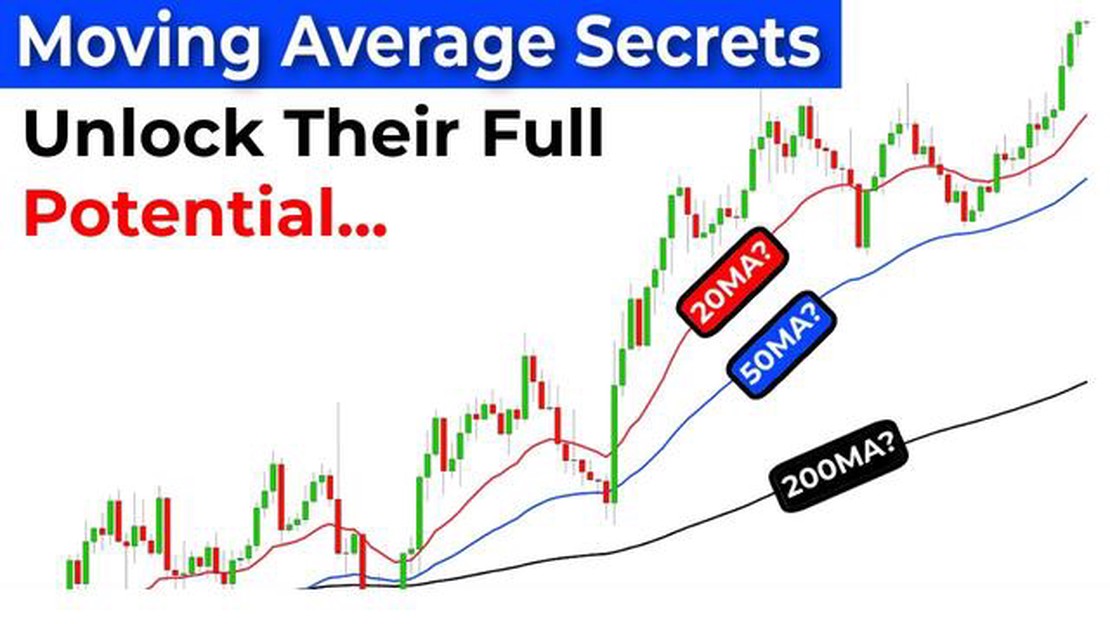
Understanding the EMA of Meta stock: A Comprehensive Guide When it comes to analyzing stock market trends, one key technical indicator that investors …
Read Article


