


Discover the Top Options Trading Teacher in India | Find Your Perfect Mentor
Who is the best teacher for options trading in India? If you want to learn options trading, finding the right teacher is crucial. With so many options …
Read Article
Harmonic patterns are a popular technique used by traders to identify potential reversals in financial markets. These patterns are based on the concept of Fibonacci ratios, which are a series of numbers that have been found to occur frequently in natural phenomena. In trading, harmonic patterns are formed when specific ratios between the price swings of an asset create symmetrical and repetitive geometric shapes on a price chart.
One type of harmonic pattern that traders often look for is the bullish harmonic pattern. This pattern suggests that the price of an asset is likely to rise in the future. Bullish harmonic patterns are characterized by a series of price swings that conform to specific Fibonacci ratios. When these ratios align, they create a bullish pattern that signals a potential bullish reversal.
Traders use various tools and techniques to identify and confirm bullish harmonic patterns. These can include Fibonacci retracement and extension levels, as well as other technical indicators such as moving averages and oscillators. By analyzing the price chart and looking for specific patterns and ratios, traders can identify potential bullish harmonic patterns and make informed trading decisions.
It’s important to note that while bullish harmonic patterns can be powerful indicators, they are not foolproof and should be used in conjunction with other forms of analysis and risk management strategies. Traders should always be aware of the potential for false signals and take steps to minimize their risk. Nevertheless, by understanding and utilizing bullish harmonic patterns, traders can potentially increase their chances of success in the financial markets.
A harmonic pattern is a specific chart pattern that indicates a potential reversal or continuation of a trend in financial markets. These patterns are based on Fibonacci ratios and occur in various financial instruments, such as stocks, currencies, and commodities.
When it comes to harmonic patterns, there are both bullish and bearish patterns. In this article, we will focus on the potential of bullish harmonic patterns.
A bullish harmonic pattern suggests that the price of an asset is likely to increase. It indicates a potential buying opportunity for traders and investors. These patterns are formed by specific price movements that conform to Fibonacci ratios, such as the 0.382, 0.50, and 0.618 retracement levels.
There are several commonly recognized bullish harmonic patterns, including the Gartley pattern, the Butterfly pattern, and the Bat pattern. Each pattern has its own specific criteria and ratios that need to be met in order to validate the pattern.
Traders who use harmonic patterns as part of their technical analysis look for these patterns to identify potential entry and exit points in the market. By recognizing bullish harmonic patterns, traders can anticipate price reversals or continuations and adjust their trading strategies accordingly.
It’s important to note that while harmonic patterns can provide valuable insights into market trends, they are not foolproof. Like any technical analysis tool, harmonic patterns are subject to interpretation and can produce false signals. Therefore, it’s essential for traders to use other indicators and tools to confirm their trading decisions.

Overall, bullish harmonic patterns offer traders valuable information regarding potential price movements in the market. By understanding and correctly identifying these patterns, traders can improve their trading strategies and increase their chances of success.
In conclusion, bullish harmonic patterns are formations in financial markets that suggest a potential increase in price. Traders and investors can utilize these patterns to make informed decisions about their trading strategies. However, it’s crucial to remember that harmonic patterns should be used in conjunction with other technical analysis indicators to validate trading decisions.
Read Also: What happens to RSU when you leave a company: a comprehensive guide
Harmonic patterns are a type of technical analysis tools that traders use to identify potential reversal points in the financial markets. These patterns are formed based on specific geometric price relationships between highs and lows on a price chart. Bullish harmonic patterns are particular types of patterns that suggest a potential bullish reversal in a downtrend.
There are several types of bullish harmonic patterns, including the Gartley pattern, the Butterfly pattern, and the Crab pattern. Each pattern has its own specific rules and guidelines for identification. Generally, these patterns consist of a series of Fibonacci retracements and extensions, which help traders determine potential entry and exit points.
When a bullish harmonic pattern forms, it indicates that the market may be approaching a turning point and that a bullish reversal could occur. Traders use these patterns to plan their trades and anticipate potential price movements. By identifying these patterns, traders can take advantage of potential profit opportunities.
It is essential to note that harmonic patterns are not foolproof indicators, and they do not guarantee a bullish reversal. They are merely tools that provide traders with potential setups and trading opportunities. Therefore, traders should use other technical analysis tools and indicators to confirm the validity of a bullish harmonic pattern before entering a trade.
In conclusion, understanding the concept of bullish harmonic patterns is crucial for traders looking to capitalize on potential bullish reversals in the markets. These patterns provide valuable insights into possible price movements and can help traders identify trading opportunities. However, it is important to remember that harmonic patterns are not infallible and should be used in conjunction with other indicators for more accurate analysis.
In trading, bullish harmonic patterns can be powerful tools for identifying potential buy opportunities in the market. These patterns are formed by a set of Fibonacci retracement and extension levels that create a geometric shape on the price chart. Traders use these patterns to predict potential trend reversals and take advantage of the subsequent bullish movement.
One of the most well-known bullish harmonic patterns is the bullish Gartley pattern. This pattern consists of four distinct price swings, labeled as XA, AB, BC, and CD. The AB and CD swings are retracements of the initial XA swing, while the BC swing is an extension of the AB swing. When these swings meet specific Fibonacci ratios, the pattern is considered complete and indicates a potential bullish reversal.
Another common bullish harmonic pattern is the bullish Butterfly pattern. This pattern is similar to the bullish Gartley pattern, but the BC swing extends beyond the XA swing instead of retracing it. The completion of this pattern signals a potential trend reversal to the upside.
Read Also: Botswana's Exchange Rate: Do They Have a Fixed Rate or Flexible System?
Traders who recognize these bullish harmonic patterns can use them as a basis for entering long positions in the market. They can place buy orders near the completion point of the pattern and set stop-loss levels below the X or A swing low to manage risk. Additionally, traders can set profit targets based on Fibonacci extension levels to maximize their profitability.
It is important to note that trading based on harmonic patterns requires skill and experience. Traders should thoroughly study and practice identifying these patterns before incorporating them into their trading strategies. Additionally, it is wise to use other technical indicators and tools to validate the signals provided by these patterns.

In conclusion, bullish harmonic patterns offer traders the opportunity to identify potential buying opportunities in the market. By understanding and recognizing these patterns, traders can increase their chances of profiting from bullish market reversals. However, it is crucial to combine harmonic pattern analysis with other technical analysis tools to confirm trading decisions and manage risk effectively.
Bullish harmonic patterns are specific chart patterns that suggest a potential bullish trend reversal in the price of an asset. They are based on the Fibonacci ratios and geometric patterns.
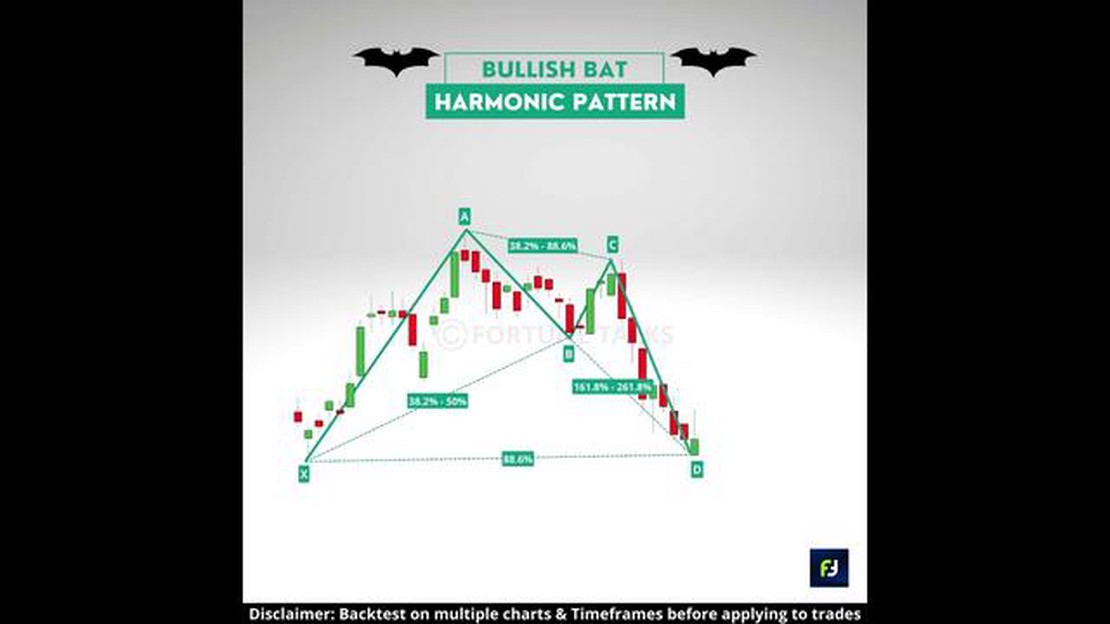
Bullish harmonic patterns form when the price of an asset experiences specific price swings that align with Fibonacci retracement and extension levels. These patterns include the Gartley, Butterfly, Crab, and Bat patterns, among others.
The Gartley pattern is a specific bullish harmonic pattern that consists of four price swings and is shaped like the letter “M” or “W”. It is formed by combining Fibonacci retracement and extension levels.
Bullish harmonic patterns are considered to be a reliable tool in technical analysis, as they have a strong historical track record of predicting price reversals. However, like any other technical analysis tool, they are not foolproof and should be used in conjunction with other indicators and analysis methods.
The potential profit targets when trading bullish harmonic patterns can vary depending on the specific pattern and the trader’s risk tolerance. Traders often look for price targets at the 38.2% and 61.8% Fibonacci retracement levels, as well as the 127.2% Fibonacci extension level.
Bullish harmonic patterns are specific price patterns on a financial chart that indicate a potential bullish reversal in the market. These patterns are formed by a combination of price swings and Fibonacci levels, and they suggest that the price is likely to move up in the near future.
To identify bullish harmonic patterns, you need to look for specific price formations, such as the Gartley pattern, the Butterfly pattern, or the Bat pattern. These patterns have specific Fibonacci ratios and symmetry requirements. By analyzing the price swings and Fibonacci levels, you can determine if a bullish harmonic pattern is present on the chart.

Who is the best teacher for options trading in India? If you want to learn options trading, finding the right teacher is crucial. With so many options …
Read Article
Is m4 markets legit? In the vast world of online trading, it is essential to find a trusted and legitimate platform to ensure the safety of your …
Read Article
What is the best hour to buy ETF? Investing in exchange-traded funds (ETFs) can be a great way to diversify your portfolio and capitalize on market …
Read Article
Creating a Comprehensive Employee Stock Option Plan: Best Practices and Structure+ Employee stock option plans are a valuable tool for companies to …
Read Article
MA 50 and MA 200 Explained: Everything You Need to Know When it comes to technical analysis in trading, moving averages (MA) are a popular and …
Read Article
7 Things to Know Before Starting Affiliate Marketing Affiliate marketing has become one of the most popular ways to earn passive income online. It …
Read Article


