


Should You Invest in Jordans: A Complete Guide
Should I Invest in Jordans? When it comes to investing, there are countless options to choose from. One area that has gained popularity in recent …
Read Article
When it comes to trading in the financial markets, being able to identify trend reversals is crucial. Recognizing when a trend is about to shift can help traders enter or exit positions at the right time, maximizing profits or minimizing losses.
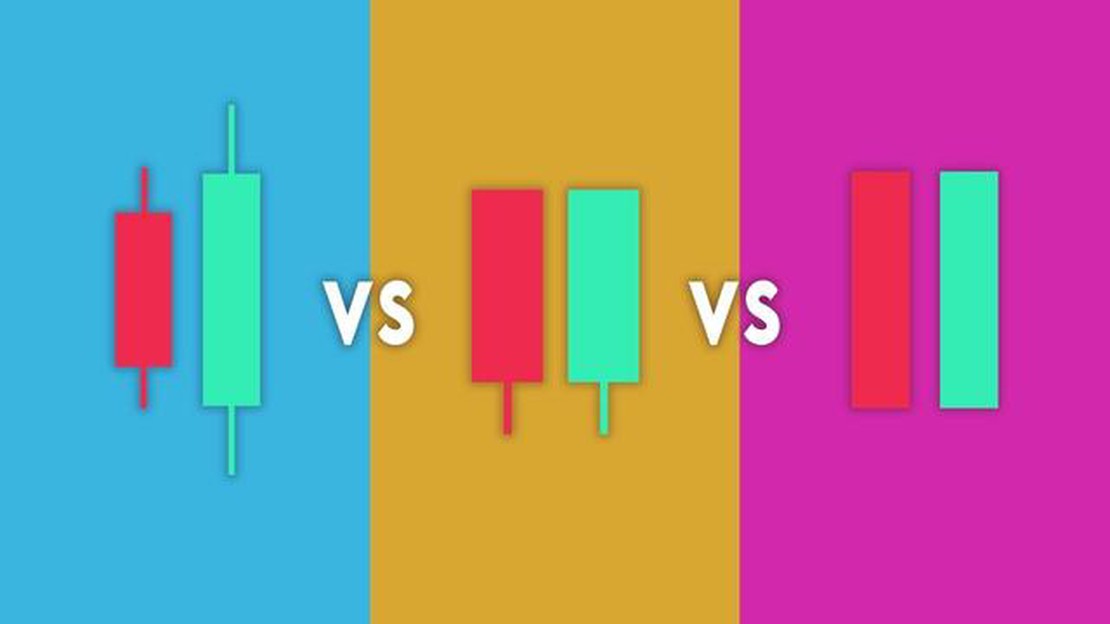
One popular tool used by technical analysts to identify trend reversals is candlestick patterns. Candlestick charts display the open, high, low, and close prices for a given time period, and the patterns they form can provide valuable insights into market sentiment.
There are several candlestick patterns that indicate a trend shift, but one of the most reliable is the “hammer” pattern. The hammer is a bullish reversal pattern that forms at the bottom of a downtrend, suggesting that the selling pressure is about to weaken and buyers are likely to take control.
Another important reversal pattern is the “shooting star.” This bearish pattern forms at the top of an uptrend and indicates that the buying pressure is about to weaken and sellers may take over. The long upper wick of the shooting star candlestick suggests that the bears are trying to push prices lower.
It is important to note that candlestick patterns should not be used in isolation. Traders should always consider other technical indicators and market conditions before making trading decisions based on these patterns. However, being able to recognize and understand these reversal patterns can be a valuable tool in a trader’s arsenal.
Identifying trend reversals in financial markets is a crucial skill for traders and investors. Candlestick patterns provide valuable insight into market sentiment and can help forecast potential changes in the direction of a trend. Here are some key candlestick patterns to watch for when looking for trend reversals:
| Pattern | Description |
|---|---|
| Hammer | A hammer is a bullish reversal pattern that forms at the bottom of a downtrend. It has a small body with a long lower shadow, indicating that buyers have stepped in and are pushing prices higher. |
| Shooting Star | A shooting star is a bearish reversal pattern that forms at the top of an uptrend. It has a small body with a long upper shadow, suggesting that sellers have overwhelmed buyers and prices may start to decline. |
| Doji | A doji is a neutral reversal pattern that occurs when the market opens and closes at the same level, creating a small or non-existent body. It indicates indecision between buyers and sellers and can be a sign of trend reversal. |
| Engulfing | An engulfing pattern occurs when a candle completely engulfs the previous candle, signaling a potential trend reversal. A bullish engulfing pattern forms at the bottom of a downtrend, while a bearish engulfing pattern forms at the top of an uptrend. |
| Evening Star | The evening star is a bearish reversal pattern that consists of three candles: a large bullish candle, followed by a small bullish or bearish candle, and then a large bearish candle. It suggests a potential trend reversal from bullish to bearish. |
| Morning Star | The morning star is a bullish reversal pattern that also consists of three candles: a large bearish candle, followed by a small bullish or bearish candle, and then a large bullish candle. It indicates a potential trend reversal from bearish to bullish. |

These are just a few examples of candlestick patterns that can indicate a potential trend reversal. Traders and investors should combine these patterns with other technical indicators and analysis tools to make informed decisions about entering or exiting trades.
Remember, no single candlestick pattern or indicator is foolproof, and it’s essential to consider the broader market context before making trading decisions.
The Doji candlestick pattern is a popular reversal pattern used by traders to indicate a potential trend shift. It is formed when the opening and closing prices of an asset are very close or equal, resulting in a small or non-existent body. The Doji pattern signifies that there is indecision or a standoff between buyers and sellers in the market.
The significance of the Doji candlestick lies in its potential to signal a trend reversal. When the Doji pattern forms after a prolonged uptrend or downtrend, it suggests that the current trend may be weakening or coming to an end. This is because the Doji indicates that neither the buyers nor the sellers were able to gain control during the trading session, resulting in a standoff.
Read Also: Drawbacks of Binary Options: Understanding the Risks and Downsides
There are different types of Doji patterns that can occur, each with its own significance. The most common types include:
1. Gravestone Doji: This Doji has a long upper shadow and no lower shadow, resembling a gravestone. It usually forms at the top of an uptrend and suggests a potential trend reversal to the downside.
Read Also: Trading in Malaysia: Which Time Zone is it in?
2. Dragonfly Doji: This Doji has a long lower shadow and no upper shadow, resembling a dragonfly. It typically forms at the bottom of a downtrend and signals a potential trend reversal to the upside.
3. Long-Legged Doji: This Doji has long upper and lower shadows, indicating high volatility and indecision in the market. It can form at any point during a trend and suggests a potential trend reversal.
It is important for traders to keep in mind that the Doji pattern alone is not sufficient to confirm a trend reversal. It should be used in conjunction with other technical indicators and price action analysis to increase the probability of a successful trade.
In conclusion, the Doji candlestick pattern is a significant tool for traders to identify potential trend reversals. Its formation indicates indecision in the market and can signal a weakening or end of the current trend. However, traders should always consider additional factors before making trading decisions based solely on the Doji pattern.

Reversal patterns in candlestick analysis are specific formations on a price chart that indicate a potential trend shift. These patterns are used by technical analysts to identify potential turning points in the market.
One of the most reliable reversal patterns in candlestick analysis is the “hammer” or “inverted hammer” pattern. This pattern occurs when the price opens significantly lower or higher than the previous close, but then reverses and closes near the high or low of the period. It indicates a potential trend reversal.
A doji candlestick pattern is significant because it indicates indecision in the market. This pattern occurs when the opening price and closing price are very close or equal, resulting in a small or non-existent body and long shadows. A doji can indicate a potential trend reversal if it forms after a strong uptrend or downtrend.
Yes, there are several candlestick patterns that can indicate a potential bearish trend shift. One such pattern is the “shooting star” pattern, which forms when the price opens higher, trades significantly higher during the period, but then closes near the low. This pattern suggests that bulls were initially in control, but selling pressure overwhelmed them, indicating a potential trend reversal.
You can use candlestick reversal patterns in your trading strategy by combining them with other technical indicators and price action analysis. For example, you can look for a reversal pattern to form near a key support or resistance level, or you can wait for confirmation from other indicators before taking a trade. It is important to remember that no pattern or indicator is 100% accurate, so proper risk management is crucial.
Reversal patterns in candlestick charting are patterns that indicate a potential trend shift in the price movement of a security. These patterns can indicate the end of a bullish trend and the start of a bearish trend, or vice versa.

Should I Invest in Jordans? When it comes to investing, there are countless options to choose from. One area that has gained popularity in recent …
Read Article
Is it cheaper to exchange money in US or Europe? When traveling internationally, one important consideration is how to exchange your money. Should you …
Read Article
Are option trading activities permitted in IRA accounts? Individual Retirement Accounts (IRAs) are popular investment vehicles that offer tax …
Read Article
What is the 1-2-3 Trading Strategy? Trading in the financial markets can be a complex and challenging endeavor. It requires a deep understanding of …
Read Article
Exploring the 4 Key Components of Forex Trading Forex, short for foreign exchange, is the largest and most liquid market in the world. It involves the …
Read Article
Profit Split on MyFundedFX: How Does It Work? When it comes to investing in the foreign exchange market, one of the key factors to consider is how …
Read Article


