

Understanding Credit Spread Strategies for Successful Investing
Understanding Credit Spread Strategies In the world of investing, credit spread strategies are becoming increasingly popular and are being employed by …
Read Article
Spotting a reversal in the forex market can be a challenging task for even the most experienced traders. However, by understanding key indicators and implementing effective strategies, you can increase your chances of identifying potential trend reversals and making profitable trades.
One of the key indicators to look out for when trying to spot a reversal is a divergence between price and momentum. This occurs when the price of a currency pair is moving in one direction, but the momentum indicator is moving in the opposite direction. This can be a strong indication that a trend reversal may be imminent.
Another important indicator to consider is the formation of reversal patterns on the price chart. These patterns, such as double tops and double bottoms, can provide valuable insights into potential reversals. By studying these patterns and understanding their significance, you can improve your ability to identify reversals and make informed trading decisions.
It’s essential to remember that no single indicator or strategy can guarantee a successful reversal trade. It’s crucial to analyze multiple indicators and use confirmation techniques to validate your trading decisions.
In addition to key indicators, implementing effective strategies can further enhance your ability to spot reversals. One popular strategy is the use of support and resistance levels. By identifying significant support and resistance levels on the price chart, you can determine potential areas where a reversal may occur.
It’s important to note that support and resistance levels should not be considered as exact prices, but rather as zones where price reactions are more likely to occur.
Another strategy to consider is the use of trendlines. Trendlines can help you identify the overall direction of a trend and potential areas where reversals may occur. By drawing trendlines and monitoring how price reacts to these lines, you can gain valuable insights into potential reversals and adjust your trading strategy accordingly.
In conclusion, spotting a reversal in the forex market is a challenging but essential skill for successful trading. By understanding key indicators such as divergence and reversal patterns, and implementing effective strategies like support and resistance levels and trendlines, you can improve your ability to identify reversals and make profitable trades.
In the world of forex trading, a reversal refers to a significant change in the direction of a currency pair’s price movement. It occurs when the prevailing trend starts to exhaust and a new trend begins to emerge in the opposite direction.

Reversals can be a highly profitable trading opportunity if identified and traded correctly. However, they can also be challenging to spot, as they often occur unexpectedly and with little warning.
There are several key indicators and strategies that forex traders can use to help identify potential reversals. One popular indicator is the Relative Strength Index (RSI), which measures the strength and speed of price movements. A reading above 70 indicates an overbought condition and a potential reversal to the downside, while a reading below 30 indicates an oversold condition and a potential reversal to the upside.
Another important indicator is the Moving Average Convergence Divergence (MACD), which compares two moving averages of a currency pair’s price to identify trend reversals. When the MACD line crosses above the signal line, it suggests a bullish reversal, while a crossover below the signal line indicates a bearish reversal.
In addition to indicators, traders can also use chart patterns to identify potential reversals. Common chart patterns include double tops and double bottoms, head and shoulders, and wedges. These patterns can signal that the current trend is about to reverse, providing traders with an opportunity to enter or exit positions.
It’s important to note that reversals in forex trading are not guaranteed and can sometimes result in false signals. Therefore, it’s essential for traders to use a combination of indicators, patterns, and other technical analysis tools to increase the probability of accurate reversal identification.
Read Also: How Many Children Died in 9/11? | Child Fatalities in the September 11 Attacks
To effectively trade reversals, traders should also consider using risk management techniques such as setting stop-loss orders and taking profits at predefined levels. This can help protect against potential losses and ensure that profits are captured when the reversal occurs.
In conclusion, understanding reversals in forex is crucial for traders who want to capitalize on market trends. By using key indicators, chart patterns, and risk management techniques, traders can increase their chances of identifying and trading successful reversals.
Read Also: What is the Best Monthly Dividend Stock? Top Picks for Consistent Income
Spotting reversals in forex can be a challenging task, as markets are constantly in flux. However, there are a few key indicators that traders can use to help identify potential reversals and make informed trading decisions.
1. Moving Averages: Moving averages can be used to identify potential trend reversals. When the price crosses above or below a moving average, it can signal a possible reversal in the market. Traders often look for crossovers between shorter-term and longer-term moving averages as a confirmation of a trend change.
2. Candlestick Patterns: Candlestick patterns can provide valuable insights into market sentiment and potential reversals. Patterns such as doji, hammer, and engulfing patterns can indicate a shift in buying or selling pressure and can be used as a signal for a possible reversal.
3. RSI (Relative Strength Index): The RSI is a momentum oscillator that measures the speed and change of price movements. When the RSI is overbought (above 70) or oversold (below 30), it can indicate a potential reversal in the market. Traders watch for divergences between the price and the RSI to confirm a reversal signal.
4. Volume: Volume can be a useful indicator for spotting reversals. An increase in volume during a price decline or increase can suggest that market participants are actively buying or selling and may signal a reversal in the market. Traders often look for volume spikes as confirmation of a reversal.

5. Support and Resistance Levels: Support and resistance levels are areas where the price has historically had difficulty moving above or below. When the price breaks through a significant support or resistance level, it can signal a potential reversal. Traders often use trendlines and chart patterns to identify these levels.
6. Divergence: Divergence occurs when the price and an indicator move in opposite directions. This can be a strong signal that a reversal is imminent. Traders often look for divergences between price and indicators such as the MACD or Stochastic oscillator as a confirmation of a reversal.
By incorporating these key indicators into their trading strategies, forex traders can increase their chances of spotting potential reversals and making profitable trades. However, it’s important to remember that no indicator is foolproof and should be used in conjunction with other analysis tools to make well-informed trading decisions.
There are several key indicators that can help you spot a reversal in forex. Some of the most commonly used indicators include moving averages, trend lines, and the Relative Strength Index (RSI). Moving averages can provide insights into the direction of the trend, while trend lines can help identify potential reversal points. The RSI is a momentum oscillator that compares the magnitude of recent gains to recent losses, helping traders determine overbought or oversold conditions.
One reliable strategy for spotting and trading reversals in forex is the use of candlestick patterns. Reversal patterns such as the double top, double bottom, head and shoulders, and inverse head and shoulders can provide valuable signals of a potential reversal. Another strategy is to use support and resistance levels to identify potential reversal points. Traders can also look for divergences between price and indicators, as these can indicate a potential reversal in trend.
Differentiating between a false reversal and a true reversal can be challenging, but there are a few techniques that can help. One approach is to look for confirmation from multiple indicators or patterns. If multiple indicators or patterns are signaling a reversal, it increases the likelihood that it is a true reversal. Another approach is to wait for a breakout above or below a key level of support or resistance. A breakout can confirm the validity of a reversal.
One common mistake traders make when trying to spot reversals in forex is relying solely on one indicator or pattern. It is important to use multiple indicators and patterns to increase the chances of accurate predictions. Another mistake is ignoring the overall trend. Trying to spot a reversal against the prevailing trend can be risky and often leads to false signals. Lastly, emotional trading can also be detrimental when trying to spot reversals. It is important to stick to a well-defined strategy and not let emotions dictate trading decisions.

Understanding Credit Spread Strategies In the world of investing, credit spread strategies are becoming increasingly popular and are being employed by …
Read Article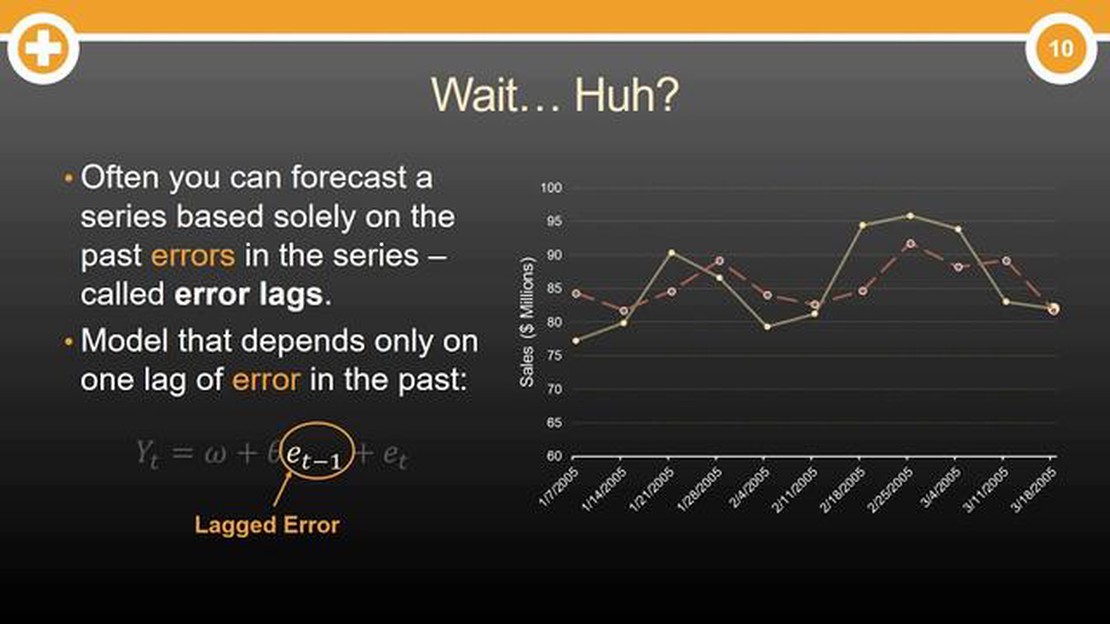
Disadvantages of the MA Model The MA model, or Moving Average model, is a commonly used forecasting method in econometrics. It is widely used in …
Read Article
What is the history of employee stock ownership plan? Employee Stock Ownership Plans (ESOPs) have a rich history dating back to the early 20th …
Read Article
Understanding the concept of dog strategy Dogs are not just our beloved pets, but also intelligent creatures with complex behaviors and communication …
Read Article
How to Calculate Lot Size MT4? One of the key aspects of successful trading in MT4 is determining the appropriate lot size for your trades. Lot size …
Read Article
Using Sentiment Analysis in Forex Trading Forex trading is a fast-paced and dynamic market, where every decision can make a significant impact on your …
Read Article


