


What is Draco slang? Uncovering the meaning and origins of this popular term
What’s a Draco Slang? In recent years, the term “Draco” has become increasingly popular among younger generations, particularly in online communities …
Read Article
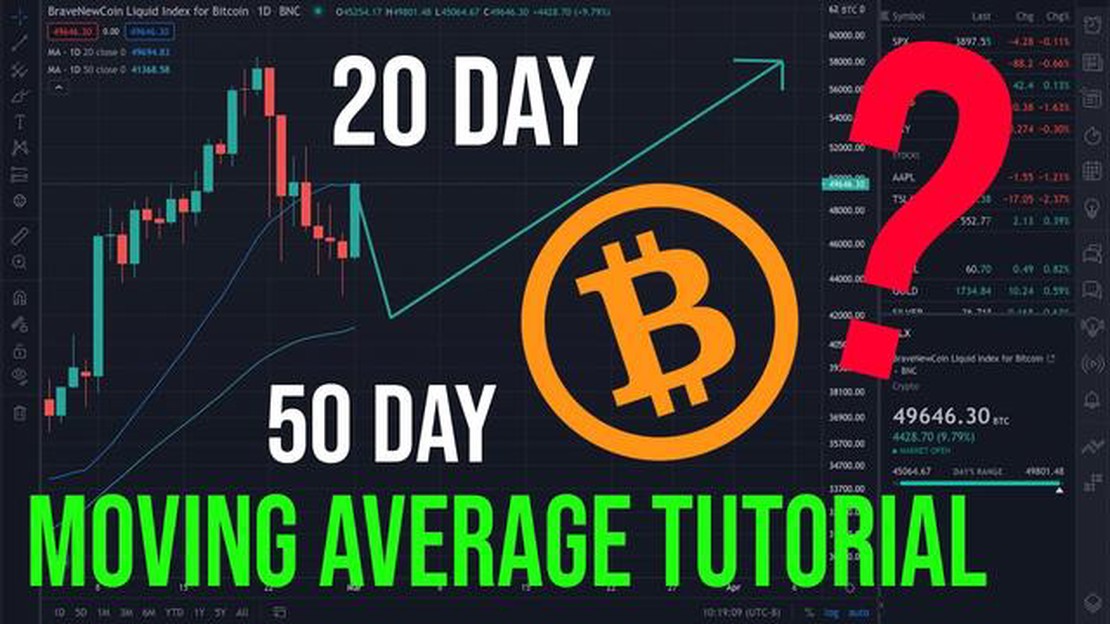
If you are interested in technical analysis, one of the popular indicators you might have come across is the Exponential Moving Average (EMA). EMA is a commonly used tool to analyze market trends and identify potential buying or selling opportunities. Among different EMA periods, the 50-day EMA is widely used by traders and investors to get a clearer understanding of the market direction and make informed decisions.
Setting up a 50-day EMA is not as complicated as it may sound. In this step-by-step guide, we will walk you through the process of setting up a 50-day EMA on your preferred charting platform. By the end of this guide, you will have a better understanding of how to use the 50-day EMA effectively in your trading strategy.
To start with, you need to choose a reliable charting platform that offers EMA indicators. There are many options available in the market, such as TradingView, MetaTrader, or Thinkorswim. Once you have selected a charting platform, you can proceed to the next step.
Next, you will need to open the chart of the financial instrument you want to analyze. This can be a stock, a cryptocurrency, or any other asset that is supported on your chosen charting platform. Once you have the chart open, you can navigate to the indicators section to add the EMA indicator.
A 50-day EMA (Exponential Moving Average) is a technical analysis indicator commonly used by traders and investors to identify trends and potential trading opportunities in the financial markets. It is calculated by taking the average price of an asset over the past 50 trading days, giving more weight to recent prices.
The EMA is a type of moving average that gives more importance to recent price data, making it more responsive to changes in price trends compared to a simple moving average. This can help traders identify potential entry or exit points in the market.
The 50-day EMA is often considered a key indicator of medium-term price trends. When the current price is above the 50-day EMA, it is generally seen as a bullish signal, indicating that the asset’s price is trending higher. On the other hand, when the current price is below the 50-day EMA, it is considered a bearish signal, suggesting that the price is trending lower.

Traders often use the 50-day EMA in conjunction with other technical indicators to confirm trading signals and make more informed trading decisions. It can be used on different timeframes, such as daily, weekly, or monthly charts, depending on the trader’s preference and trading strategy.
It is important to note that the 50-day EMA is just one tool among many in a trader’s toolkit and should not be used in isolation. It is always recommended to combine technical indicators with other forms of analysis, such as fundamental analysis and market sentiment, to increase the probability of successful trades.
There are several reasons why using a 50-day Exponential Moving Average (EMA) can be beneficial for investors and traders.
1. Identifying trends: The 50-day EMA can help investors identify the overall trend of a security or market. By calculating the average price over the past 50 days and smoothing out the fluctuations, the 50-day EMA provides a clearer picture of whether the price is generally increasing or decreasing.
2. Support and resistance levels: The 50-day EMA often acts as a support or resistance level for a security. When the price is above the 50-day EMA, it indicates that the security is in an uptrend, and the 50-day EMA may act as a support level. Conversely, when the price is below the 50-day EMA, it suggests a downtrend, and the 50-day EMA may act as a resistance level.
Read Also: Discover the Popular Currency Nicknames in Forex Trading
3. Entry and exit points: Traders can use the 50-day EMA to determine optimal entry and exit points for trades. When the price crosses above the 50-day EMA, it may signal a buy signal, indicating that the security is gaining strength and it’s a good time to enter a long position. On the other hand, when the price crosses below the 50-day EMA, it may indicate a sell signal, suggesting that the security is weakening and it’s time to exit a position.
4. Reducing noise: The 50-day EMA smooths out short-term price fluctuations, making it easier for investors to focus on the overall trend. It helps filter out the market noise and provides a more reliable indicator of the security’s direction.
Read Also: Can I Practice Trading with Mock Trading Accounts?
5. Popular among traders: The 50-day EMA is widely used by traders and investors due to its simplicity and effectiveness. It has become a standard tool in technical analysis and is frequently referenced and watched by market participants.
Overall, the 50-day EMA is a valuable tool for analyzing price trends, identifying support and resistance levels, determining entry and exit points, reducing noise, and gaining insights into the overall market sentiment. By incorporating the 50-day EMA into your trading strategy, you can make more informed decisions and potentially improve your trading outcomes.
Setting up a 50-day exponential moving average (EMA) can help traders identify trends and make informed investment decisions. Follow these steps to set up a 50-day EMA:
By following this step-by-step guide, you can easily set up a 50-day EMA and use it as a valuable tool in your trading strategy.
A 50-day EMA is a technical indicator used in stock market analysis. It stands for 50-day Exponential Moving Average, which is calculated by taking the average of a stock’s closing prices over the past 50 trading days.

The 50-day EMA is important because it helps traders identify trends and potential buy or sell signals. It is often used as a reference point for determining the strength of a stock’s momentum.
Setting up a 50-day EMA is relatively simple. First, you need to choose a stock charting platform that allows you to plot moving averages. Then, select the 50-day EMA option and apply it to your chart. The platform will automatically calculate and plot the 50-day EMA line for you.
Yes, there are several trading strategies that incorporate the 50-day EMA. One popular strategy is the “Golden Cross,” which occurs when the stock’s short-term moving average (e.g., 50-day EMA) crosses above its long-term moving average (e.g., 200-day EMA). This is seen as a bullish signal.
Absolutely! The 50-day EMA can be used for analyzing other financial markets such as forex, commodities, and cryptocurrencies. The principle remains the same – it helps identify trends and potential trading opportunities.
A 50-day Exponential Moving Average (EMA) is a technical indicator used in stock market analysis to smooth out price fluctuations and identify trends over a 50-day period. It is calculated using a formula that gives more weight to recent prices, making it more responsive to recent market movements.
The 50-day EMA is important because it helps traders and investors identify the direction of the market trend. When the price is above the 50-day EMA, it indicates a bullish trend, while a price below the 50-day EMA indicates a bearish trend. Traders use this information to make informed decisions about buying or selling stocks.

What’s a Draco Slang? In recent years, the term “Draco” has become increasingly popular among younger generations, particularly in online communities …
Read Article
Exploring the SMS Trading Strategy: A Comprehensive Overview In the fast-paced world of trading, staying ahead of the market is crucial. That’s where …
Read Article
What is the formula for average speed? Understanding the concept of average speed is crucial in physics and everyday life. Average speed is a measure …
Read Article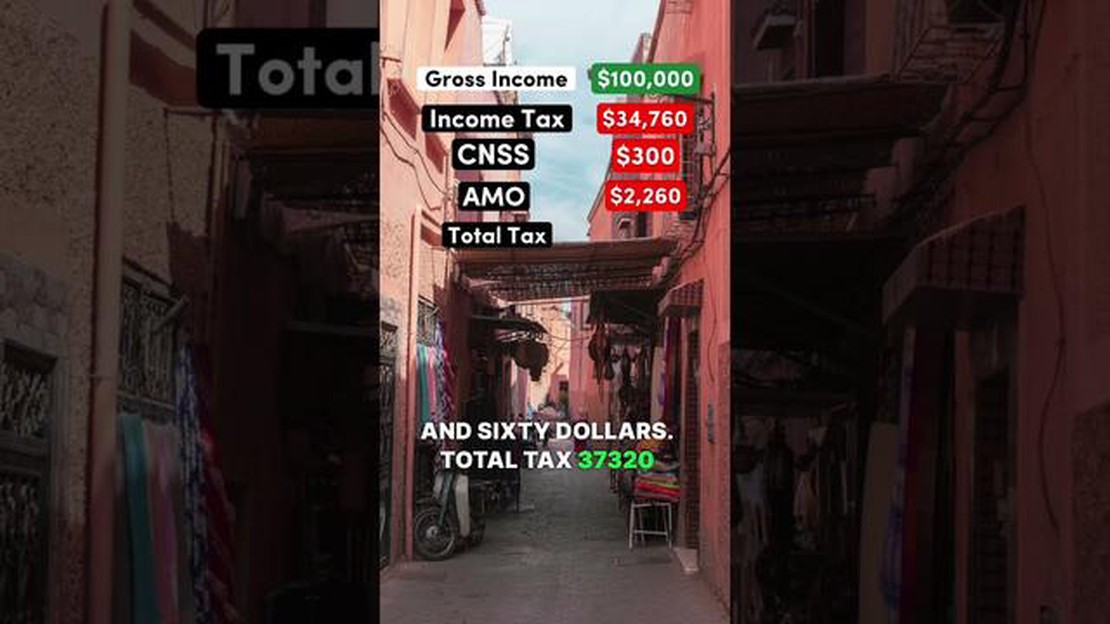
What is the salary of a trader in Morocco? Have you ever wondered how much traders in Morocco earn in the financial markets? Trading has become a …
Read Article
Understanding Forex Rebates: How They Work and the Benefits Forex rebates have become a popular tool for traders to maximize their profits in the …
Read Article
Understanding 1 Minute Scalping Moving Average Strategy In the world of forex trading, there are numerous strategies that traders can use to maximize …
Read Article


