


Trade in Ancient Rome: A look at the Roman's methods and resources
Trade in Ancient Rome: What Commodities Did Romans Use? The ancient Romans were known for their vast and sophisticated trading network, which played a …
Read Article
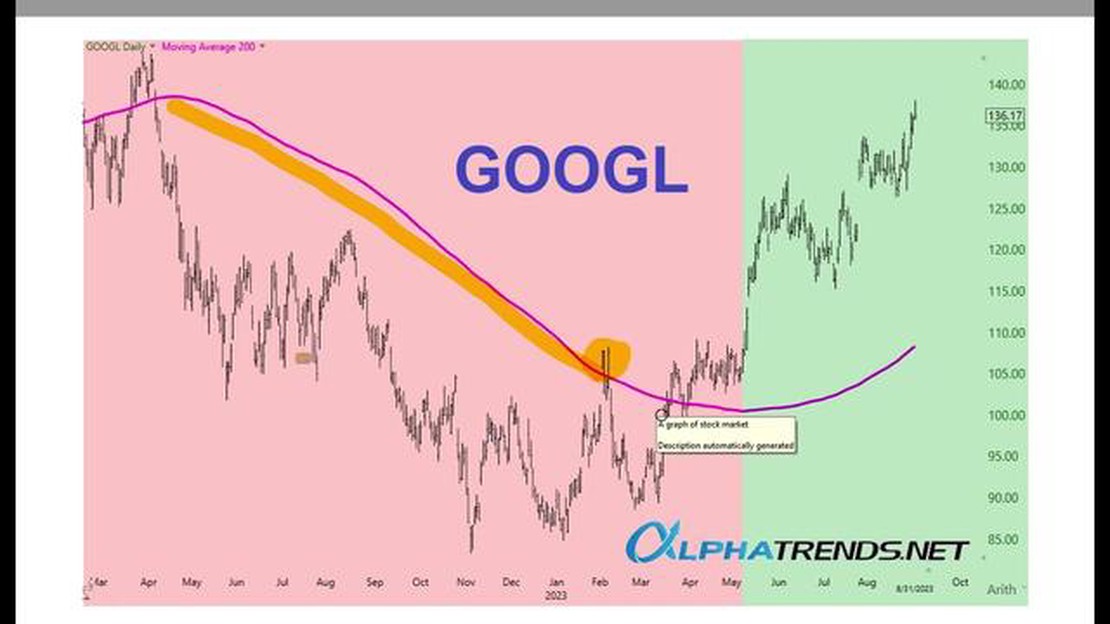
Setting a 200 Moving Average (MA) is an essential step in technical analysis for traders and investors. The MA is a widely used indicator that helps identify the direction of a trend and potential areas of support or resistance. By setting a 200 MA, traders can analyze long-term trends and make informed decisions about market entry and exit points.
To set a 200 MA, you first need to choose a financial instrument or asset that you wish to analyze. This could be a stock, currency pair, commodity, or index. Once you have selected the asset, you will need access to a charting platform that allows you to plot moving averages. Many online brokers and trading platforms offer this functionality, making it easily accessible for both beginner and experienced traders.

Once you have opened a chart for your chosen asset, locate the “Indicators” or “Studies” tab on the platform. Under this tab, you will find a list of available indicators, including moving averages. Select the 200 MA option from the list and click on it to apply it to your chart. The platform will then display the 200 MA line on the chart, representing the average closing price over the past 200 periods.
Pro Tip: Keep in mind that the 200 MA is a long-term trend indicator and is often used by traders and investors who focus on the daily or weekly timeframes. If you are a short-term trader, you may also want to consider using shorter MAs, such as the 50 or 20 MA, to analyze shorter-term trends and potential entry or exit points.
Once you have set the 200 MA on your chart, it is important to analyze how the price interacts with this indicator. A common approach is to consider a bullish trend when the price is above the 200 MA and a bearish trend when the price is below it. Additionally, traders often look for crossovers between the price and the 200 MA as potential entry or exit signals.
Read Also: How to add currency pairs to your iPhone MT4: a step-by-step guide
Remember that setting a 200 Moving Average is just one tool in a trader’s toolbox, and it should be used in conjunction with other technical indicators and analysis techniques. By combining various tools, traders can gain a more comprehensive understanding of the market and make more informed trading decisions.
A 200 moving average is a technical analysis tool that calculates the average price of a security over a specified period of time, typically 200 days. It is used to identify the long-term trend of a stock or market.
The 200 moving average is commonly used because it is a good indicator of the long-term trend. It helps to smooth out short-term fluctuations and provides a clearer picture of the overall direction of the market or stock price.
To set a 200 moving average on your trading platform, you will need to open the indicator settings and select “Moving Average.” Then, choose the period as 200 days and select the type of moving average you prefer, such as simple or exponential. Finally, apply the settings to your chart.
Read Also: Step-by-Step Guide: How to Add an Indicator to Your Forex Tester
When the price crosses above the 200 moving average, it is generally considered a bullish signal. It indicates that the stock or market is potentially entering an uptrend. Traders may interpret this as a signal to buy or hold onto their positions.
While the 200 moving average is primarily used for long-term trend analysis, it can also be used by short-term traders as a reference point for support and resistance levels. Traders may look for opportunities to enter or exit positions when the price interacts with the 200 moving average on shorter timeframes.
A 200 Moving Average is a technical indicator that shows the average price of a security over the past 200 periods.


Trade in Ancient Rome: What Commodities Did Romans Use? The ancient Romans were known for their vast and sophisticated trading network, which played a …
Read Article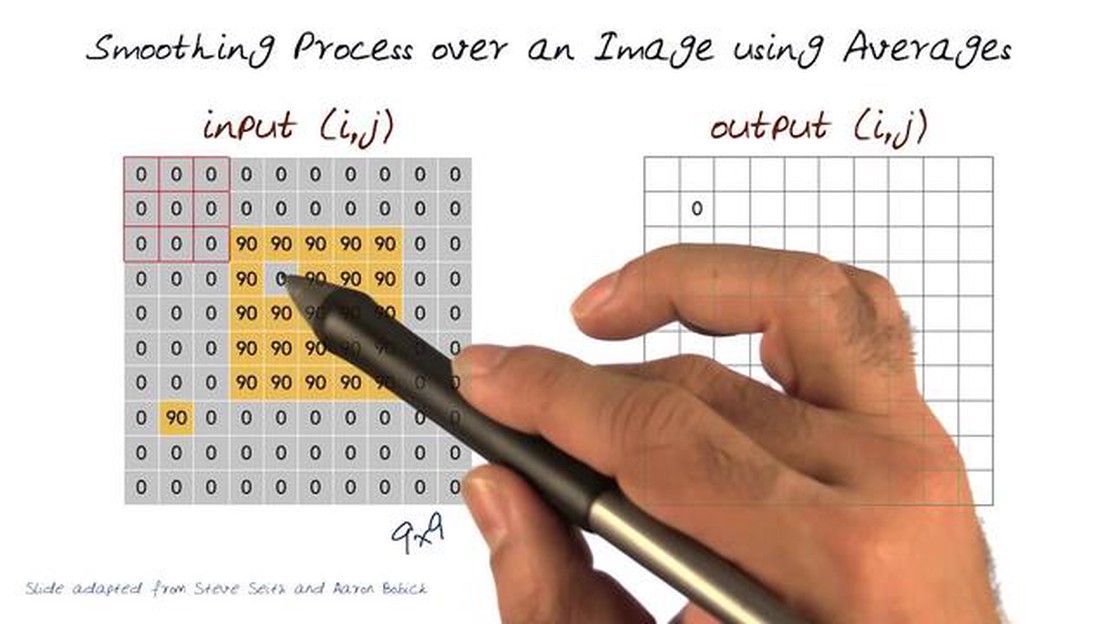
Effect of Averaging Filter Averaging filters are commonly used in signal processing to smooth out noise and improve the quality of data. These filters …
Read Article
Is FBS safe in Pakistan? Forex trading has gained popularity in Pakistan in recent years, with more and more people looking to make money from the …
Read Article
Requirements to Set Up a Forex Bureau in Uganda Are you interested in starting your own forex bureau in Uganda? This comprehensive guide will walk you …
Read Article
Calculating Options: A Comprehensive Guide Options are a popular investment vehicle that allows investors to speculate on the future price movements …
Read Article
Minimum Fund Requirement for Forex Trading Forex, or foreign exchange, is a decentralized market where currencies are traded. It’s a popular …
Read Article


