

Calculating Average Demand Forecast: A Step-by-Step Guide
How to Calculate Average Demand Forecast Accurate demand forecasting is essential for businesses to effectively manage their inventory, production, …
Read Article
Forecasting is an essential tool for businesses and individuals looking to make informed decisions about the future. One popular method used for forecasting is the Simple Moving Average (SMA). The SMA is a trend-following indicator that helps identify potential trends and predict future values based on past data. In this step-by-step guide, we will explore how to forecast using the SMA and how it can be applied to different scenarios.
To begin forecasting with the SMA, it is important to understand what it represents. The SMA calculates the average value of a specific data set over a given period of time. This moving average line can then be used to identify patterns and trends in the data. By analyzing these trends, we can make predictions about future values.

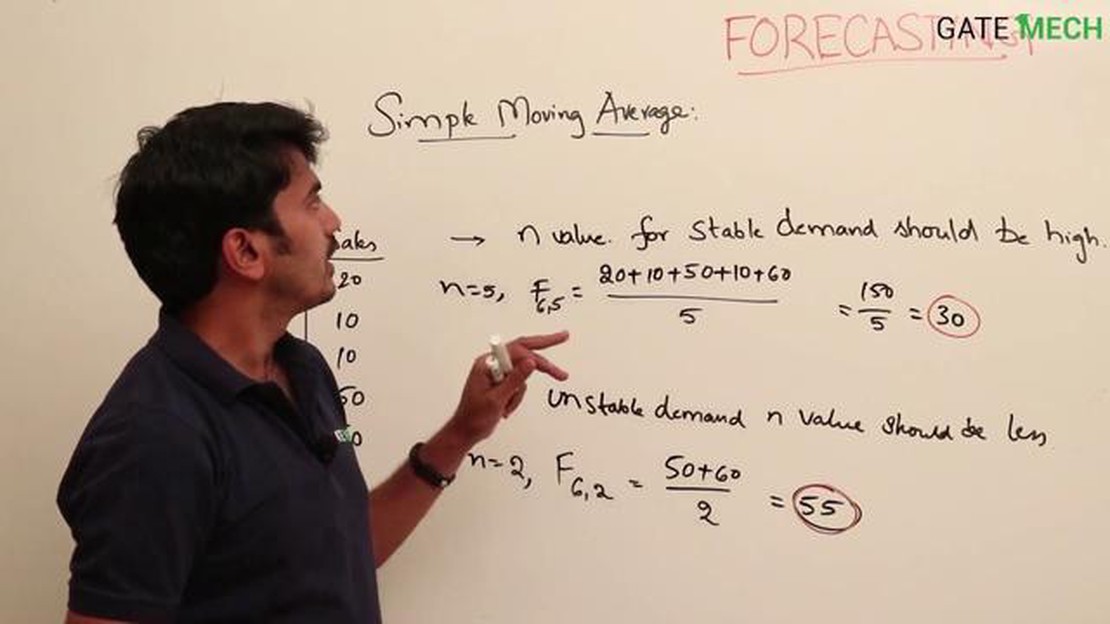
In order to forecast using the SMA, we first need to determine the period of time that will be used for the moving average calculation. The choice of period will depend on the nature of the data and the time frame being analyzed. A shorter period may be more responsive to recent changes, while a longer period may smooth out fluctuations and provide a broader perspective.
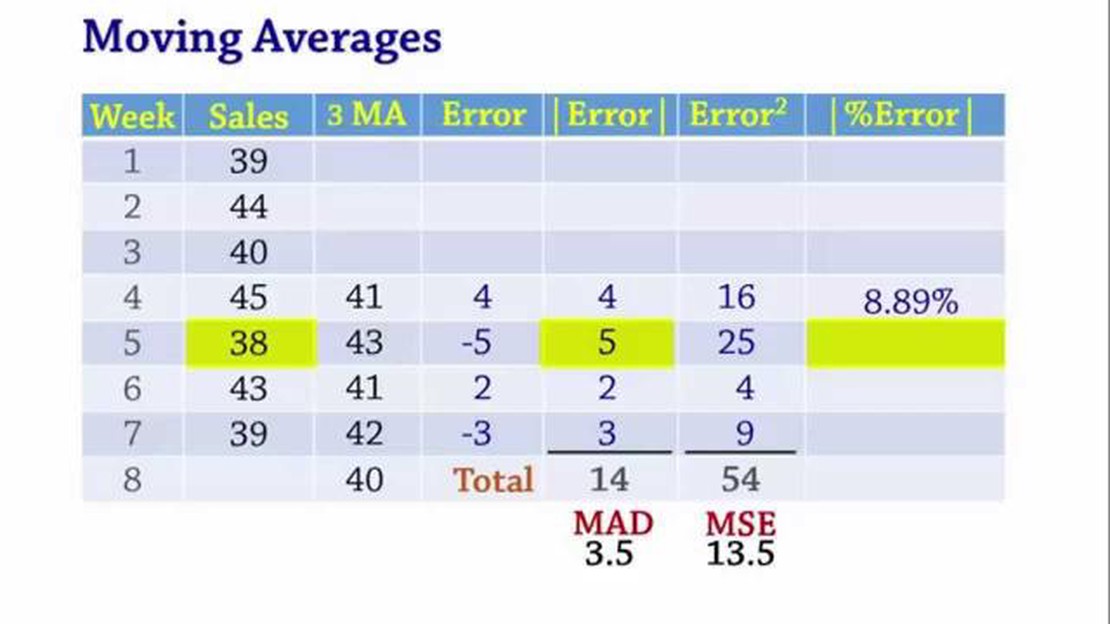
Once the period has been determined, the SMA can be calculated by adding up the values of the data set over the specified period and then dividing by the number of data points. This will give us the average value for that period. By repeating this calculation for each period, we can create a series of average values that form the SMA line.
With the SMA line in place, we can then use it to forecast future values. By analyzing the patterns and trends in the SMA, we can make predictions about the direction of the data. If the SMA line is increasing, it suggests that the data is trending upward and we can expect future values to follow suit. Conversely, if the SMA line is decreasing, it suggests a downward trend and we can anticipate future values to reflect this as well.
In conclusion, the Simple Moving Average is a powerful tool for forecasting future values based on past data. By understanding how to calculate and interpret the SMA, individuals and businesses can make more informed decisions about the future. Whether used for financial analysis, sales forecasting, or trend analysis, the SMA can provide valuable insights into potential future outcomes.
Read Also: Understanding the ESPP Plan for Gilead: Benefits, Eligibility, and Key Features
Simple Moving Average (SMA) is a popular technical analysis tool used to identify trends and analyze price movements in financial markets. It is a calculation that helps in smoothing out price data by creating a constantly updated average of past prices over a specific time period. The SMA is often used by traders and analysts to generate buy or sell signals, as well as to determine support and resistance levels.
To calculate the SMA, you need to add up the closing prices for a specified number of periods and then divide the sum by the number of periods. For example, if you want to calculate the 50-day SMA for a particular stock, you would add up the closing prices of the stock for the past 50 days and divide the sum by 50. This will give you the SMA value for that day. As new price data becomes available, the SMA is recalculated by dropping the oldest price and including the most recent one.
The SMA can be used to identify trends in different timeframes. Shorter-term moving averages, such as the 10-day or 20-day SMA, are more responsive to recent price changes and can help traders identify short-term trends. On the other hand, longer-term moving averages, such as the 50-day or 200-day SMA, are slower to react to price changes but can provide a better indication of long-term trends.
The SMA is a relatively simple and straightforward tool that is widely used by technical analysts and traders. While it is not a perfect predictor of future price movements, it can provide valuable insights into market trends and help traders make more informed trading decisions.
The simple moving average (SMA) is a popular forecasting technique used in various fields such as finance, economics, and statistics. It is a widely used method for calculating trends and forecasting future values based on historical data.
Here are some reasons why the SMA is frequently used:
Read Also: Understanding Stock Options for New Hires: A Comprehensive Guide
In conclusion, the use of a simple moving average can provide valuable insights into the trends and patterns of historical data. This technique is widely used due to its simplicity, ability to smooth out short-term fluctuations, and its application in various fields.
A moving average is a statistical calculation that is commonly used in forecasting to smooth out fluctuations in data over time. It is calculated by averaging a series of values over a specified period and is used to identify trends and patterns in data.
The appropriate period for a moving average forecast can vary depending on the data set and the nature of the data. It is often advisable to experiment with different time periods to find the best fit for the specific data being analyzed. Shorter periods may provide more granular insights, but can also be more sensitive to variations and noise in the data. Longer periods can help identify longer-term trends, but may not capture short-term fluctuations. The choice of period should ultimately be based on the specific goals and requirements of the analysis.
Yes, there are some limitations and drawbacks to using a simple moving average for forecasting. One limitation is that it gives equal weight to all data points within the specified period, regardless of their proximity to the present. This means that older data points have the same impact as more recent ones, which may not accurately reflect the current trend. Additionally, simple moving averages may not be suitable for data with irregular patterns or sudden changes. In such cases, more advanced forecasting techniques, such as exponential moving averages or trend analysis, may be more appropriate.


How to Calculate Average Demand Forecast Accurate demand forecasting is essential for businesses to effectively manage their inventory, production, …
Read Article
How to Create a Watchlist? Keeping track of the things that matter to you is important, and creating a watchlist can help you stay organized and …
Read Article
Choosing the Best Stock to Earn Money Quickly When it comes to investing in the stock market, finding the right stock can be the key to making money …
Read Article
Beginner’s Guide on How to Invest in Binary Options Binary options trading is a popular and accessible way to invest in the financial markets. It …
Read Article
Stock options: how are they awarded? Stock option awards are a type of incentive offered by a company to its employees, allowing them to purchase a …
Read Article
How to predict a draw match Football is an incredibly popular sport worldwide, and predicting the outcome of matches can be both exciting and …
Read Article


