


Is Trading in MCX a Good Investment? | Pros and Cons Explained
Is trading in MCX good? Trading in the Multi Commodity Exchange (MCX) can be an enticing opportunity for investors. MCX is one of the largest …
Read Article
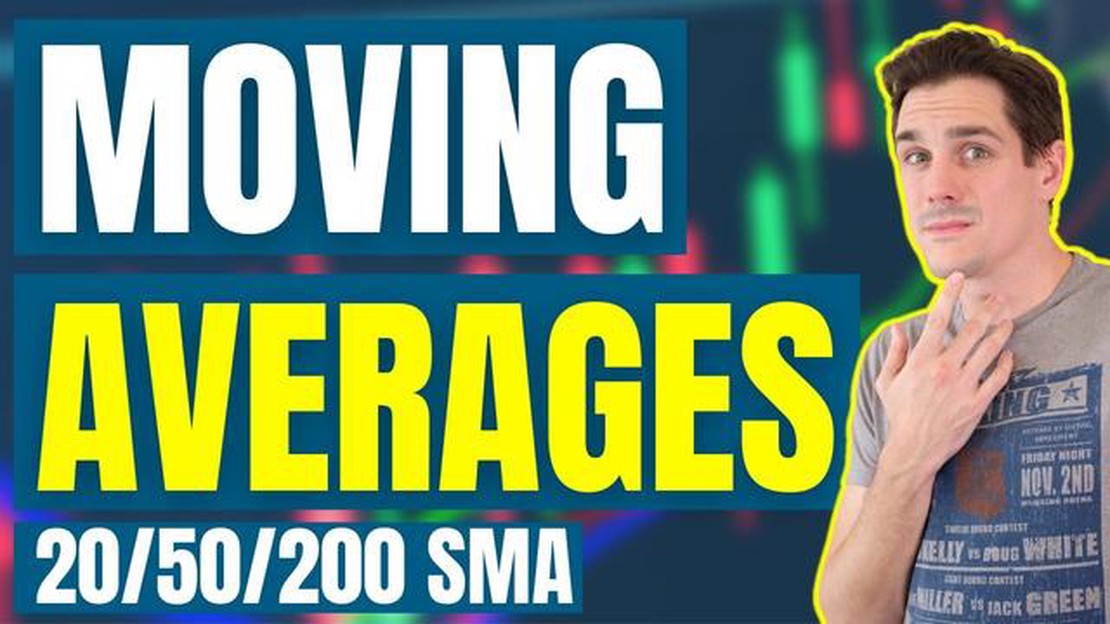
When it comes to trading, understanding and effectively using technical indicators can make all the difference in your success. One commonly used set of indicators in the trading world is the 20, 50, and 200 Exponential Moving Averages (EMAs). These indicators can help traders identify trends, make informed trading decisions, and manage risk.
The 20 EMA is a short-term moving average that provides traders with a quick snapshot of the recent price action. It is often used to confirm the direction of the trend and identify potential entry and exit points. Traders look for the price to cross above or below the 20 EMA as a signal of a potential trend reversal or continuation.
The 50 EMA is a medium-term moving average that provides traders with a smoothed view of the price action over a longer period. It is used to identify the overall direction of the trend and can act as a support or resistance level. When the price is above the 50 EMA, it indicates a bullish trend, while a price below the 50 EMA suggests a bearish trend.
The 200 EMA is a long-term moving average that provides traders with a broader view of the price action. It is used to identify major trends and can act as a strong support or resistance level. Traders often look for the price to bounce off the 200 EMA as a sign of a potential trend reversal or continuation.
By effectively using the 20, 50, and 200 EMA, traders can gain valuable insights into the market and make more informed trading decisions. These indicators can help traders identify trends, manage risk, and improve their overall trading performance.
The 20, 50, and 200 Exponential Moving Averages (EMA) are commonly used technical indicators in trading. These moving averages provide traders with valuable insights into the behavior and trend of a particular financial instrument.

The EMA is a type of moving average that assigns more weight to recent price data, making it more responsive to changes in market conditions compared to the Simple Moving Average (SMA). This responsiveness allows traders to better capture short-term trends and market fluctuations.
The 20 EMA is a short-term moving average that represents the average price of the last 20 periods. It is often used to identify short-term trends and provide timely trading signals. When the price crosses above the 20 EMA, it is considered a bullish signal, indicating a potential buying opportunity. Conversely, when the price crosses below the 20 EMA, it is seen as a bearish signal, suggesting a potential selling opportunity.
The 50 EMA is a medium-term moving average that represents the average price of the last 50 periods. It provides traders with a broader perspective and helps identify the overall trend of a financial instrument. When the price is above the 50 EMA, it is considered bullish, indicating a potential uptrend. On the other hand, when the price is below the 50 EMA, it is considered bearish, suggesting a potential downtrend.
The 200 EMA is a long-term moving average that represents the average price of the last 200 periods. It is commonly used to identify major trends and support and resistance levels. When the price is above the 200 EMA, it is generally considered bullish and indicates a strong uptrend. Conversely, when the price is below the 200 EMA, it is generally considered bearish and indicates a strong downtrend.
Read Also: Understanding the N d1 and N d2 in Black-Scholes: The Key to Option Pricing
| Moving Average | Period | Significance |
|---|---|---|
| 20 EMA | Short-term | Identify short-term trends and trading signals |
| 50 EMA | Medium-term | Identify overall trend and market direction |
| 200 EMA | Long-term | Identify major trends and support/resistance levels |
By understanding the 20, 50, and 200 EMA, traders can gain valuable insights into the current and future behavior of a financial instrument. These moving averages can help identify potential entry and exit points, validate trading signals, and provide confirmation of market trends. However, it is important to note that moving averages should not be used in isolation and should be used in conjunction with other technical indicators and analysis methods for a comprehensive trading strategy.
An exponential moving average (EMA) is a type of moving average that places greater emphasis on recent data points, making it more responsive to recent price changes compared to a simple moving average (SMA). It is widely used in technical analysis to identify trends, determine support and resistance levels, and generate trading signals.
The EMA is calculated by applying a weighting factor to each data point in the time series, with the weight decreasing exponentially as the data points move further back in time. This weighting factor is determined by the length or the number of periods used in the calculation.
The formula to calculate the EMA involves adding a percentage of the difference between the current price and the previous EMA value to the previous EMA value. The percentage is determined by the length of the EMA.
EMAs are commonly used with different timeframes, such as 20, 50, and 200 periods. The 20 EMA is often used by short-term traders to identify short-term trends and entry/exit points. The 50 EMA is commonly used by medium-term traders to identify medium-term trends and support/resistance levels. The 200 EMA is widely used by long-term traders to identify long-term trends and as a measure of overall market direction.
Read Also: Is GBP JPY a Major Forex Pair?
When the price is above the EMA, it indicates a bullish trend, while a price below the EMA indicates a bearish trend. Crossovers between different EMAs can also provide trading signals, with a bullish crossover occurring when a shorter-term EMA crosses above a longer-term EMA, and a bearish crossover occurring when a shorter-term EMA crosses below a longer-term EMA.
Traders often use EMAs in conjunction with other technical indicators and price patterns for confirmation and to avoid false signals. It is important to note that while EMAs can be effective in identifying trends and generating trading signals, they are not foolproof and can result in false or late signals, especially during choppy or ranging market conditions.
| EMA Period | Typical Timeframe | Common Use |
|---|---|---|
| 20 | Short-term | Identify short-term trends and entry/exit points |
| 50 | Medium-term | Identify medium-term trends and support/resistance levels |
| 200 | Long-term | Identify long-term trends and measure overall market direction |
The 20, 50, and 200 EMAs stand for Exponential Moving Averages with time periods of 20, 50, and 200, respectively. They are commonly used indicators in technical analysis to track the average price of an asset over a specific time period.

The 20, 50, and 200 EMAs can be used to identify trends, support and resistance levels, and potential entry or exit points. Traders often look for crossovers between these moving averages to generate buy or sell signals. Additionally, they may use the position of the price relative to these averages to determine the overall market sentiment.
When the price crosses above the 200 EMA, it is considered a bullish signal, indicating a potential uptrend. Conversely, when the price crosses below the 200 EMA, it is viewed as a bearish signal, suggesting a possible downtrend.
Yes, the 20, 50, and 200 EMAs can be used for day trading. Traders can apply these moving averages to shorter timeframes, such as 5-minute or 15-minute charts, to identify short-term trends and potential trading opportunities.
Yes, traders often combine the 20, 50, and 200 EMAs with other technical indicators, such as the Relative Strength Index (RSI) or the Moving Average Convergence Divergence (MACD), to confirm signals or provide additional insights into market conditions.

Is trading in MCX good? Trading in the Multi Commodity Exchange (MCX) can be an enticing opportunity for investors. MCX is one of the largest …
Read Article
The most accurate forex pattern revealed Foreign exchange, commonly known as forex, is the largest and most liquid financial market in the world. …
Read Article
India’s Forex Reserves Ownership: An In-Depth Analysis The foreign exchange reserves of a country play a crucial role in its economic stability and …
Read Article
Trading Options on Futures with TD Ameritrade TD Ameritrade is a leading brokerage firm that offers a wide range of investment products and services …
Read Article
Understanding the Differences Between TSX and TSXV Exchanges When it comes to investing in the Canadian stock market, two exchanges stand out: the TSX …
Read Article
Understanding the Meaning of RSI 5 RSI 5, or the Relative Strength Index 5, is a widely used technical indicator in the field of finance and …
Read Article


