Seasonal index is a powerful tool used by businesses and analysts to identify patterns and trends in quarterly data. By calculating the seasonal index, you can determine the impact of seasonal fluctuations on your business performance and make more informed decisions.
In this step-by-step guide, we will walk you through the process of calculating the quarterly seasonal index. Whether you are a business owner, a manager, or an analyst, this guide will help you better understand how to analyze and interpret quarterly data.
Table Of Contents
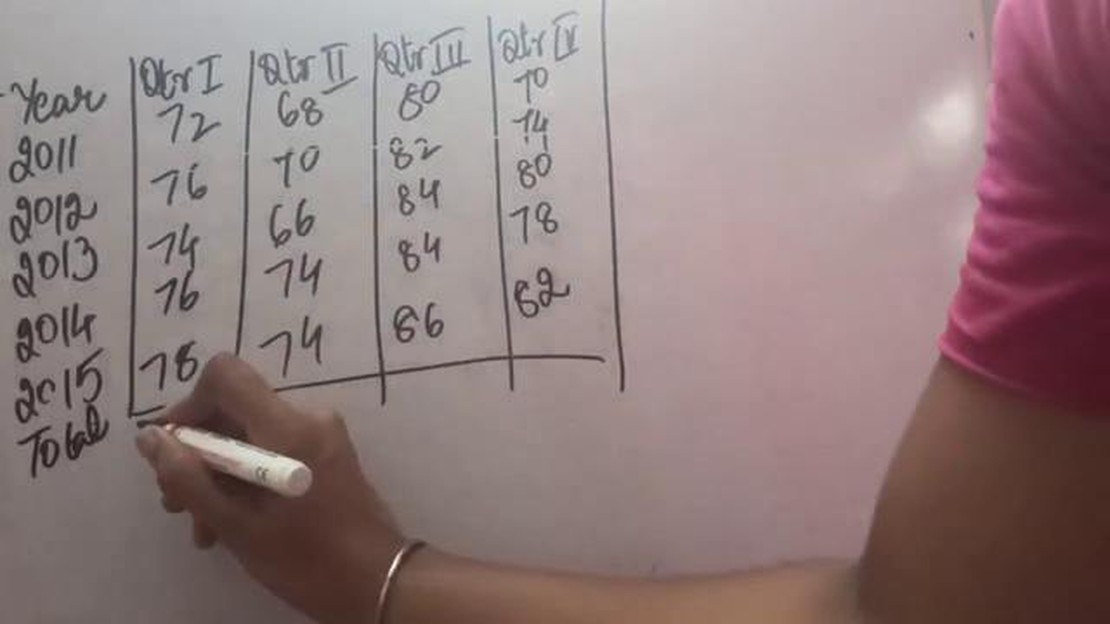
To calculate the seasonal index, you need to gather quarterly data for a specific period of time, usually a minimum of three years. This data should include the actual sales, revenue, or any other variable you want to analyze. Once you have the data, you can start calculating the seasonal index.
The first step is to calculate the average for each quarter. This will give you the average performance for each quarter over the specified period. Next, divide each quarterly value by the corresponding average to get the seasonal component for each quarter. This will help you understand how each quarter performs compared to the average.
After calculating the seasonal components, it’s time to calculate the quarterly seasonal index. To do this, divide each quarterly value by the sum of all the quarterly seasonal components and multiply it by 100. This will give you the percentage contribution of each quarter to the overall seasonal pattern.
By following these steps, you will be able to calculate the quarterly seasonal index and gain valuable insights into the seasonal patterns affecting your business. This information can then be used to make strategic decisions, optimize operations, and plan for future growth.
Understanding the Importance of Seasonal Variation
Seasonal variation refers to the predictable pattern of changes that occur in a dataset over specific periods of time, typically within a year. It is an important factor to consider when analyzing data because it can significantly impact trends and patterns.
Seasonal variation can be observed in various industries and sectors, such as retail, tourism, agriculture, and finance. For example, in the retail industry, sales tend to be higher during holiday seasons, such as Christmas or Black Friday. Similarly, the tourism industry experiences peak seasons during summer or school breaks when people are more likely to travel.
By understanding seasonal variation, businesses can make more accurate forecasts and strategic decisions. Analyzing past data and identifying seasonal patterns can help businesses anticipate higher demand during certain periods and adjust their production, marketing, and staffing accordingly.
Furthermore, seasonal indexes provide a quantitative measure of seasonal variation. They help in adjusting data to remove the effects of seasonality and uncover underlying trends. This is particularly important when comparing data from different periods or making predictions based on historical data.
Calculating the quarterly seasonal index is a valuable tool for understanding and quantifying the seasonal variation within a year. It allows businesses to see how each quarter compares to the overall seasonal pattern and identify any specific trends or deviations.
In conclusion, understanding and accounting for seasonal variation is essential for accurate data analysis and forecasting. By recognizing and quantifying these patterns, businesses can make more informed decisions and better plan for the future.
The quarterly seasonal index is a tool used to identify seasonal patterns in a time series data set. It helps to determine the degree of variation within each quarter of a year, allowing for better forecasting and planning. The calculation method for the quarterly seasonal index involves several steps:
Step 1: Data Collection - Gather the relevant time series data for the analysis. This data should cover multiple years, ideally at least three to five years, to capture seasonal variations.
Step 2: Data Preparation - Clean and organize the collected data. Remove any outliers and data points that are irrelevant or have errors. Make sure the data is in chronological order and that it aligns with the desired time interval.
Step 3: Calculate the Average - Find the average value for each quarter by summing the values for all quarters within a particular year and dividing it by the number of quarters.
Step 4: Calculate the Grand Average - Calculate the grand average by summing the averages across all the years and dividing it by the number of years.
Step 5: Calculate the Seasonal Factor - Divide each quarterly average by the grand average to obtain the seasonal factor. This factor represents the proportional difference between the average value of a particular quarter and the grand average.
Step 6: Adjustment - If necessary, adjust the seasonal factors to ensure that their sum is equal to the number of quarters within a year (usually 4) by applying a scaling factor.
Step 7: Interpretation - Analyze the seasonal factors to identify any significant patterns or deviations from the average. Use this information to make informed decisions about future forecasting and planning.
By following these steps, the quarterly seasonal index can provide valuable insights into the seasonal patterns within a time series data set. It allows businesses and analysts to better understand and predict the fluctuations in their data, leading to more accurate planning and decision-making.
FAQ:
What is a quarterly seasonal index?
A quarterly seasonal index is a metric used to measure the average seasonal fluctuations in a particular time period, such as a quarter of a year.
How is the quarterly seasonal index calculated?
The quarterly seasonal index is calculated by dividing the actual value for a specific quarter by the average value for all quarters in a year, and then multiplying by 100.
Why is it important to calculate the quarterly seasonal index?
Calculating the quarterly seasonal index is important because it helps identify and understand the seasonal patterns and fluctuations in a business or industry, which can be used to make informed decisions and predictions.
Can the quarterly seasonal index be used to forecast future quarters?
Yes, the quarterly seasonal index can be used to forecast future quarters by applying the calculated index to the corresponding quarters in the future, taking into account the expected average seasonal fluctuations.
Are there any limitations or challenges in calculating the quarterly seasonal index?
Yes, there are some limitations and challenges in calculating the quarterly seasonal index. These include the availability and accuracy of historical data, the presence of outliers or irregular patterns, and the need to update the index regularly to account for changes in the business or industry.
What is a quarterly seasonal index?
A quarterly seasonal index is a measure used to predict and analyze seasonal patterns in data over a quarter, typically for sales or financial data. It helps identify trends and adjust forecasting models for seasonality.
What is ADX Histogram? The Average Directional Index (ADX) is an indicator used in technical analysis to measure the strength of a trend. It provides …