How to Calculate the Moving Average in Time Series Analysis
Time series analysis is a statistical technique used to analyze data points collected over time. One of the key tools in time series analysis is the moving average, which helps to smooth out the fluctuations in the data and identify underlying trends. It is widely used in various fields such as finance, economics, and meteorology.
Table Of Contents
The moving average is a simple and effective method to analyze time series data. It calculates the average of a specific number of data points over a predetermined period, and then moves the window forward one data point at a time to calculate new averages. This sliding window approach helps to identify short-term fluctuations and long-term trends in the data.
To calculate a moving average, first determine the window size or the number of data points to include in the average calculation. A larger window size will result in a smoother average, but it may also obscure smaller fluctuations in the data. Next, choose the type of moving average to calculate, such as the simple moving average or the weighted moving average.
The simple moving average is the most commonly used method. To calculate it, sum up the data points within the window and divide by the number of data points. The weighted moving average assigns different weights to the data points based on their positions within the window. This allows giving more importance to recent data or specific data points. There are also other variations of the moving average, such as the exponential moving average and the cumulative moving average.
Overall, calculating a moving average is a valuable technique in time series analysis as it helps to identify trends, filter out noise, and make predictions. By understanding how to calculate and interpret moving averages, one can gain insights into the underlying patterns and behaviors of the data, enabling better decision-making and forecasting.
What is a moving average
A moving average is a commonly used statistical calculation that is used in time series analysis. It is used to smooth out data by calculating the average value of a subset of data points over a specific time period.
When analyzing time series data, it can be difficult to see the underlying trends and patterns due to noise or random fluctuations in the data. This is where a moving average can be helpful. By calculating the average value over a certain number of periods, a moving average can help to highlight the overall trend or pattern in the data.
There are different types of moving averages that can be used, such as the simple moving average (SMA) and the exponential moving average (EMA). The simple moving average calculates the average value based on an equal weighting of each data point in the subset. The exponential moving average, on the other hand, assigns more weight to the recent data points, which can give more importance to recent trends or changes in the data.
The choice of the time period for the moving average calculation can depend on the specific analysis and the characteristics of the data. Shorter time periods can provide a more sensitive or responsive moving average that can capture shorter-term trends or changes. On the other hand, longer time periods can provide a smoother moving average that can highlight longer-term trends or patterns in the data.
Moving averages are commonly used in various fields, such as finance, economics, and engineering. They can be used to analyze stock prices, economic indicators, and sensor data, among other things. By calculating and visualizing the moving average, analysts can gain insights into the overall trend or pattern in the data, which can help with decision making and forecasting.
Definition and concept
In time series analysis, a moving average is a common tool used to smooth out fluctuations in data and identify underlying trends or patterns. It is also known as a rolling average or moving mean. The moving average calculates the average of a certain number of data points within a sliding window. By sliding the window along the time series, a sequence of averages is obtained, which can highlight the overall trend of the data.
The concept of the moving average is based on the assumption that the current value of a data point is influenced not only by previous values, but also by future values. This is particularly useful when dealing with time-dependent data, such as stock prices, sales figures, or weather patterns.
The size of the window used to calculate the moving average is a crucial parameter that determines the level of smoothing. A smaller window size results in a more responsive moving average, capturing short-term fluctuations, while a larger window size smoothes out these fluctuations and emphasizes long-term trends.
The moving average is widely used in various fields, including finance, economics, engineering, and signal processing. It serves as a fundamental tool for analyzing and interpreting time series data, allowing researchers and analysts to make informed decisions and predictions based on the underlying patterns and trends.
Applications in time series analysis
Time series analysis is widely used in various fields for studying and predicting different types of data that change over time. Here are some common applications of time series analysis:
Economics and finance: Time series analysis is extensively used in economics and finance to understand and forecast variables such as stock prices, exchange rates, inflation rates, and GDP growth. It helps economists and financial analysts make informed decisions and develop models that capture the complex dynamics of these variables.
Weather forecasting: Time series analysis plays a crucial role in weather forecasting by analyzing historical weather data. It helps meteorologists identify patterns and trends in temperature, precipitation, wind speed, and other weather variables, allowing them to make accurate predictions for the future.
Healthcare: In the healthcare industry, time series analysis is employed to analyze patient data over time. It helps identify disease outbreaks, predict patient readmissions, monitor vital signs, and assess the effectiveness of medical treatments and interventions.
Stock market analysis: Traders and investors use time series analysis techniques to analyze historical stock market data and identify potential trends, patterns, and cycles. It helps them make informed decisions about buying, selling, and holding stocks, and develop trading strategies based on historical price movements.
Marketing and sales: Time series analysis is employed in marketing and sales to analyze historical sales data and identify seasonal patterns, trends, and demand forecasting. It helps companies optimize pricing, inventory management, and promotional campaigns based on past sales behavior.
Quality control: Manufacturers use time series analysis to monitor and control the quality of their production processes. By analyzing time-stamped data from sensors and instruments, they can identify deviations, detect anomalies, and make adjustments to ensure product quality and reduce defects.
Transportation analysis: Time series analysis is used in transportation planning and management to analyze traffic data, travel patterns, and congestion. It helps in predicting traffic flows, optimizing transportation systems, and improving mobility and efficiency.
These are just a few examples of the numerous applications of time series analysis across different industries. By studying the patterns and trends in time-dependent data, analysts can gain valuable insights and make informed decisions in various domains.
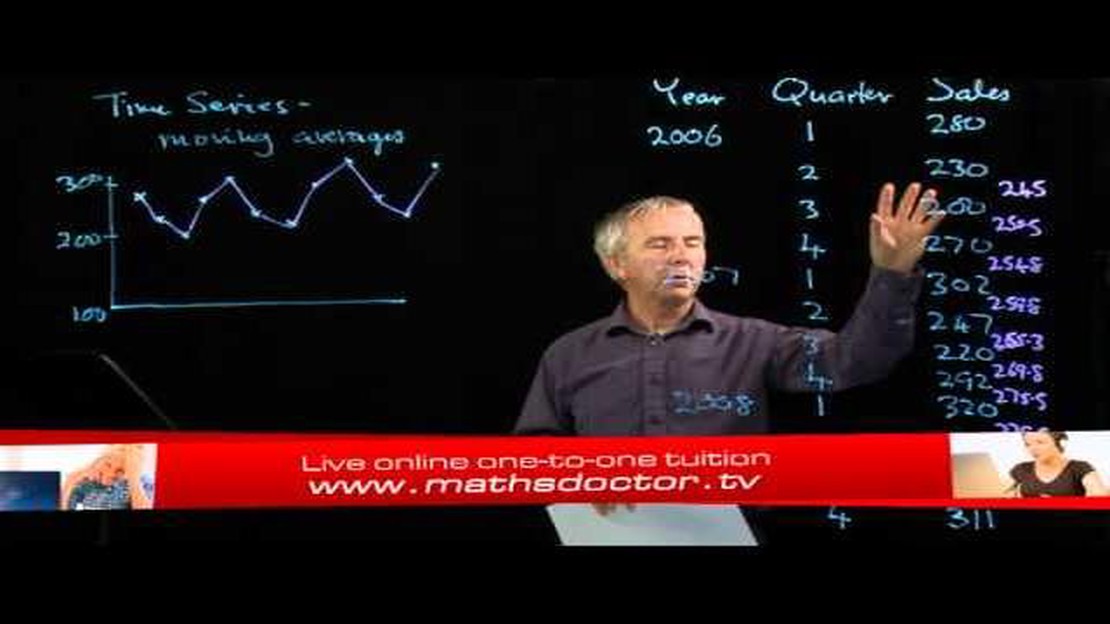
A moving average in time series analysis is a calculation used to analyze trends over a specific period of time. It involves taking the average of a subset of data points within a time series and shifting the subset one data point at a time until the entire series has been traversed.
Why is calculating a moving average important in time series analysis?
Calculating a moving average is important in time series analysis because it helps to smooth out random fluctuations and highlight underlying trends or patterns. It allows analysts to better understand the overall direction of the data and make predictions about future values.
How do you calculate a simple moving average?
To calculate a simple moving average, you add up a set of data points within a specific window or time period, and then divide the sum by the number of data points in that window. This is repeated for each subsequent window, moving one data point at a time, until the entire series has been traversed.
What is the purpose of using different window sizes when calculating a moving average?
The purpose of using different window sizes when calculating a moving average is to analyze trends at different levels of granularity. A smaller window size will respond quickly to short-term fluctuations, while a larger window size will provide a smoother trend by averaging over a longer period of time.
Can a moving average be used to forecast future values in a time series?
Yes, a moving average can be used to forecast future values in a time series. By calculating the moving average for a specific window size and projecting it into the future, analysts can make predictions about the direction and magnitude of future data points.
What is a moving average in time series analysis?
A moving average in time series analysis is a calculation that helps to smooth out fluctuations and identify trends in data over a specific time period. It is widely used in finance, economics, and other fields to analyze and forecast data.
Best Bank Account for Forex Trading in India When it comes to forex trading in India, one of the most important decisions you’ll make is choosing the …