


Understanding Margin Requirements for Level 3 Options Trading
Margin Requirements for Level 3 Options: Do I Need Them? When it comes to trading options, understanding margin requirements is crucial, especially …
Read Article
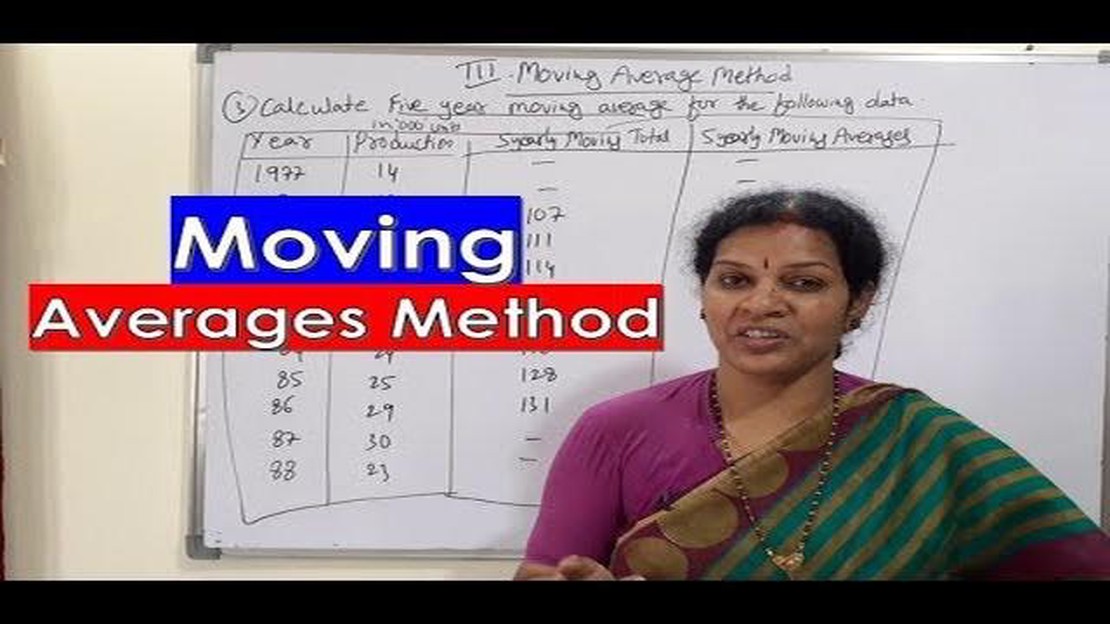
Calculating a 3 year moving average is a useful tool in analyzing trends and patterns in data over a period of time. This method involves calculating the average of a data set over a rolling 3-year period, which helps to smooth out fluctuations and highlight long-term trends.
To calculate a 3 year moving average, you first need to gather the data for the specific variable you want to analyze. This could be anything from stock prices to sales figures or even weather data. Once you have your data, you can begin the calculation process.
The first step is to select a starting point for your 3-year window. This could be the first data point in your series or any other point you want to begin your analysis from. Once you have your starting point, you move the window forward by one year and recalculate the average. You continue this process, moving the window forward by one year each time, until you reach the end of your data set.
By calculating a 3 year moving average, you can smooth out any short-term fluctuations and focus on the overall trend. This can help in making predictions, identifying patterns, and making informed decisions based on the data. Additionally, it can be used as a forecasting tool to estimate future values based on past trends.

Moving averages are a commonly used statistical tool in finance and data analysis to understand trends and patterns in time series data. They provide a smoothed representation of the data by calculating the average of a specific number of preceding data points.
A moving average is calculated by taking the sum of a set of data points over a specified period and then dividing it by the number of data points in that period. For example, a 3-year moving average would be calculated by taking the sum of the data points for the current year and the two preceding years, and then dividing it by 3.
Moving averages are useful in smoothing out short-term fluctuations and identifying long-term trends in data. They are particularly helpful when dealing with noisy or volatile data, as they provide a clearer picture of the underlying pattern.
There are different types of moving averages, such as simple moving averages (SMA) and exponential moving averages (EMA). SMA gives equal weight to all data points in the period, while EMA assigns more weight to recent data points. The choice of which type to use depends on the specific analysis and the intended purpose.
Moving averages can be used to identify support and resistance levels, generate buy or sell signals, and estimate future prices or values. They are also used in technical analysis to determine trend direction and strength.
Read Also: Is Go Market Legit? Uncovering the Truth About Go Market
It is important to note that moving averages are a lagging indicator, meaning that they are based on past data and may not accurately predict future trends or patterns. However, they are still valuable tools for understanding and interpreting historical data.
In conclusion, moving averages are a valuable tool in analyzing time series data. They provide a smoothed representation of the data, help identify trends and patterns, and can be used for various financial and analytical purposes. Understanding how to calculate and interpret moving averages is crucial for anyone working with time series data.
A 3 year moving average, also known as a three-year rolling average or three-year moving mean, is a statistical calculation used to analyze data over a specific period of time. It provides a smoothed average value that removes some of the short-term fluctuations in data, making it easier to identify long-term trends and patterns.
To calculate a 3 year moving average, you take the average of a data set over a three-year period. This involves adding up the values for the past three years and dividing it by three. As new data becomes available, the oldest year of data is dropped, and the newest year is included in the calculation.
Read Also: Does Elliot Wave work? Debunking the effectiveness of the Elliot Wave Theory
For example, let’s say you have annual sales data for a company from the years 2015 to 2020. To calculate the 3 year moving average for year 2020, you would take the average of the sales data for the years 2018, 2019, and 2020. In 2021, the calculation would shift to the years 2019, 2020, and 2021, and so on.
The purpose of using a 3 year moving average is to smooth out short-term fluctuations and reveal underlying trends and patterns. It helps to filter out noise and provides a clearer picture of the overall direction of the data set. This can be particularly useful in financial analysis, economic forecasting, and other fields where identifying long-term trends is important.
A moving average is a statistical calculation used to analyze data over a certain period of time by smoothing out fluctuations and identifying trends.
Calculating a moving average helps in identifying trends and patterns in data by removing short-term fluctuations and noise.
To calculate a 3-year moving average, you need to sum up the values of the past 3 years’ data points and divide it by 3, then repeat this calculation for each subsequent year.

Yes, a moving average can be calculated for any time period depending on the data and the analysis requirements.
A 3-year moving average can be used in various fields such as finance, sales forecasting, and economic analysis. It helps in understanding long-term trends and making informed decisions based on historical data.

Margin Requirements for Level 3 Options: Do I Need Them? When it comes to trading options, understanding margin requirements is crucial, especially …
Read Article
Best Time for Scalping Forex trading is a popular investment method that allows traders to buy and sell currencies on the foreign exchange market. …
Read Article
Does Questrade Offer Forex Trading Services? Welcome to the Questrade FAQ! In this article, we will answer the question of whether Questrade offers …
Read Article
Understanding the Golden Cross Moving Average Strategy When it comes to investment strategies, the Golden Cross Moving Average strategy is one that …
Read Article
Understanding the Weekly Moving Average Concept The weekly moving average is a popular technical analysis tool used by traders and investors to …
Read Article
The Average Forex Cost Forex, or foreign exchange market, is a decentralized global marketplace where currencies are traded. It is one of the largest …
Read Article


