


Is FBS Trader a Reliable Platform? 2021 Review and User Feedback
Is FBS Trader trustworthy? When it comes to online trading, choosing a reliable platform is crucial for success. FBS Trader is one platform that has …
Read Article
Technical analysis is a crucial tool for investors and traders to make informed decisions in the financial markets. By studying historical price charts and market data, technical analysts aim to predict future price movements and identify trends that can help guide their trading strategies.
In this comprehensive guide, we will explore the three main approaches to technical analysis: trend following, trend reversal, and breakout. Each approach offers unique insights and methods for analyzing market data, using different indicators and chart patterns.
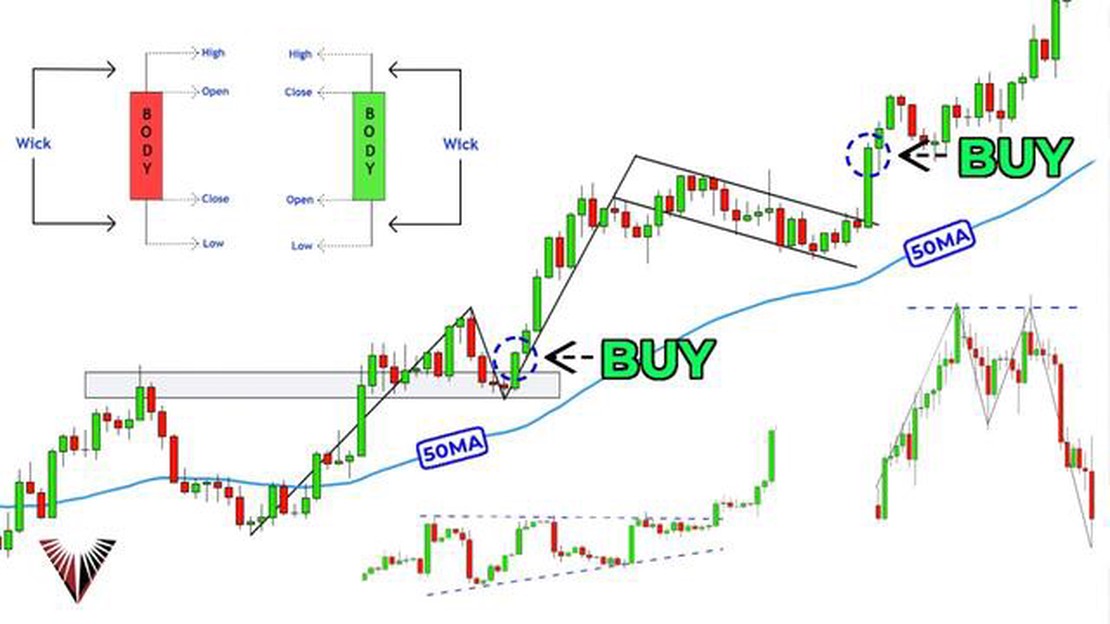
The trend following approach focuses on identifying and following trends in the market. Traders using this approach believe that price trends have a higher probability of continuing rather than reversing. They use indicators such as moving averages and trendlines to determine the direction of the trend and make trading decisions accordingly.

The trend reversal approach, as the name suggests, aims to identify potential reversals in the market. Traders using this approach look for signals that indicate a trend may be ending, such as divergences between price and indicators, or overbought/oversold conditions. By recognizing these signs, traders can take advantage of price reversals and make profitable trades.
The breakout approach focuses on identifying key levels of support and resistance on price charts. Traders using this approach look for instances where the price breaks out of these levels, signaling a potential trend continuation or reversal. Breakout traders often use indicators such as Bollinger Bands or other volatility-based indicators to gauge the strength of a breakout and make trading decisions accordingly.
By understanding and exploring these three technical analysis approaches, traders can develop a well-rounded trading strategy that incorporates multiple perspectives and techniques. This guide will provide a comprehensive overview of each approach, discussing their strengths, weaknesses, and best practices for implementation. Whether you are a beginner or an experienced trader, this guide will equip you with the knowledge and tools to navigate the complex world of technical analysis with confidence.
Read Also: Understanding Managerial Stock Options and Their Benefits
Technical analysis is a method used by traders to forecast future price movements of financial assets through the examination of historical price and volume data. It is based on the premises that historical price patterns repeat themselves and that markets are driven by supply and demand.
This definitive guide aims to provide a comprehensive understanding of technical analysis, covering its basic concepts, tools, and methodologies. By the end of this guide, you will have a solid foundation in technical analysis and be equipped with the necessary knowledge to apply it effectively in your own trading strategies.
Technical analysis revolves around the analysis of price charts, which display the historical price movements of an asset. Traders use various chart types, such as line charts, bar charts, and candlestick charts, to identify trends, patterns, and support/resistance levels.
The key principles of technical analysis include:
Technical analysis employs a range of tools and techniques to analyze price data and make trading decisions. Some commonly used tools and techniques include:
While technical analysis is widely used by traders, it has its limitations and critics. Some common criticisms of technical analysis include:
Despite these limitations, many traders find value in technical analysis as a tool for identifying trading opportunities and managing risk. By combining technical analysis with other forms of analysis and risk management techniques, traders can increase their chances of success in the financial markets.
The three technical analysis approaches are chart patterns, indicators, and Japanese candlestick patterns. Chart patterns analyze historical price data to identify patterns that can predict future price movements. Indicators use mathematical calculations based on price and volume data to generate trading signals. Japanese candlestick patterns interpret price movements and market sentiment based on the pattern and shape of candlestick formations.
Read Also: How to Change the Default Stock Option in Magento 2 | Step-by-Step Guide
Chart pattern analysis works by identifying recurring patterns in historical price data. Traders use various chart patterns such as triangles, head and shoulders, double tops and bottoms, and cup and handle patterns to predict future price movements. The patterns are formed by price action and can provide insights into potential market reversals or continuations.
Some popular indicators used in technical analysis include Moving Average Convergence Divergence (MACD), Relative Strength Index (RSI), and Bollinger Bands. MACD is used to identify potential buy and sell signals based on the convergence or divergence of moving averages. RSI measures the speed and change of price movements to determine overbought or oversold conditions. Bollinger Bands are used to assess volatility and potential price breakouts.
Japanese candlestick patterns are a type of charting technique that originated in Japan. They involve analyzing the shape and pattern of candlesticks to interpret price movements and market sentiment. Common candlestick patterns include doji, hammer, shooting star, engulfing patterns, and more. Traders use these patterns to make predictions about future price movements and potential trend reversals.

There isn’t a definitive answer to which technical analysis approach is the most effective as it depends on various factors, including the trader’s strategy, time frame, and personal preference. Some traders may find chart patterns more reliable, while others may prefer using indicators or Japanese candlestick patterns. It’s important for traders to experiment and find the approach that works best for them.

Is FBS Trader trustworthy? When it comes to online trading, choosing a reliable platform is crucial for success. FBS Trader is one platform that has …
Read Article
Using cTrader on my iPhone: A Step-by-Step Guide If you’re an active trader looking for a reliable and user-friendly mobile trading app, cTrader is an …
Read Article
Living in Dubai as a Forex Trader: Is it Possible? Dubai, the vibrant city known for its towering skyscrapers, luxurious lifestyle, and thriving …
Read Article
Understanding the Volume Moving Average In the world of finance, trading relies on a wide range of indicators and tools to make informed decisions. …
Read Article
Understanding the Power of Leverage: How It Can Benefit You Leverage is a powerful tool that allows individuals and businesses to multiply their …
Read Article
Responsibilities and duties of an FX salesperson An FX (foreign exchange) salesperson is a professional who sells financial services and products …
Read Article


